This is the second in a series of posts examining the viability of various forms of unsubsidized electricity. Particular focus in the series is on newbuild solar, natural gas-fired and nuclear generation.
The goal of the series is simple—to discern fact from fiction when it comes to our power grids. In the process, we expect to challenge core assumptions underpinning the energy policies of many Western nations.
This post is the second in our series. It examines the breakeven cost of a large grid powered exclusively by natural gas-fired generation assets. In our opinion, its findings—supported by pragmatic analysis—demonstrate that natural gas is a demonstrably competitive fuel for the generation of power on a modern grid.
Setting aside the question of whether a large power grid could (or should) be served by 100% natural gas-fired generation (or any other singular form of energy), this analysis—which is essentially a thought experiment—needs to be conducted.
One reason is to provide a comparison with the breakeven of a PV-hybrid system, one powered solely by a combination of unsubsidized solar panels and battery energy storage systems (BESS) serving the same demand configuration.
Another reason to conduct the analysis is that if there is a single fuel that could reliably be counted on to provide both affordable and fit-for-purpose power, it seems gas-fired generation could be it. Gas is not only proven to be capable of efficiently serving both baseload and peaker loads, but it can also service the in-between (ie, intermediate or shoulder) demand as well.
Testing the Gas-fired Thesis
We previously developed a breakeven model for a system powered exclusively by PV-hybrid assets, which ultimately proved to be much more costly than the cheap fuel cost would suggest. In this post, we will calculate the breakeven for the same grid with a supply-side configuration of only gas-fired assets. We’ll follow an approach similar to that used in the PV-hybrid analysis as allows an apples-to-apples comparison of the two hypothetical configurations.
Before we start the analysis, let’s clarify some basic guidelines for configuring and modeling our all gas-fired system:
- All power consumed on the system must come from gas-fired generation assets on the grid. Given the capabilities of gas-fired generation, there is no energy storage or imports assumed on the system of any kind.
- The grid’s power supply can come either directly from a gas turbine or indirectly from a steam turbine driven by waste heat from operating gas turbines.
- The mix of generating assets assumed in each scenario is determined by the mix of the following three types of demand on the grid.
- Baseload—We define baseload demand as that which exists on the system 24 hours a day, 365 days per year. Baseload capacity is the level of capacity needed to service year-round baseload demand without assistance from either intermediate- or peaker-class generating capacity.
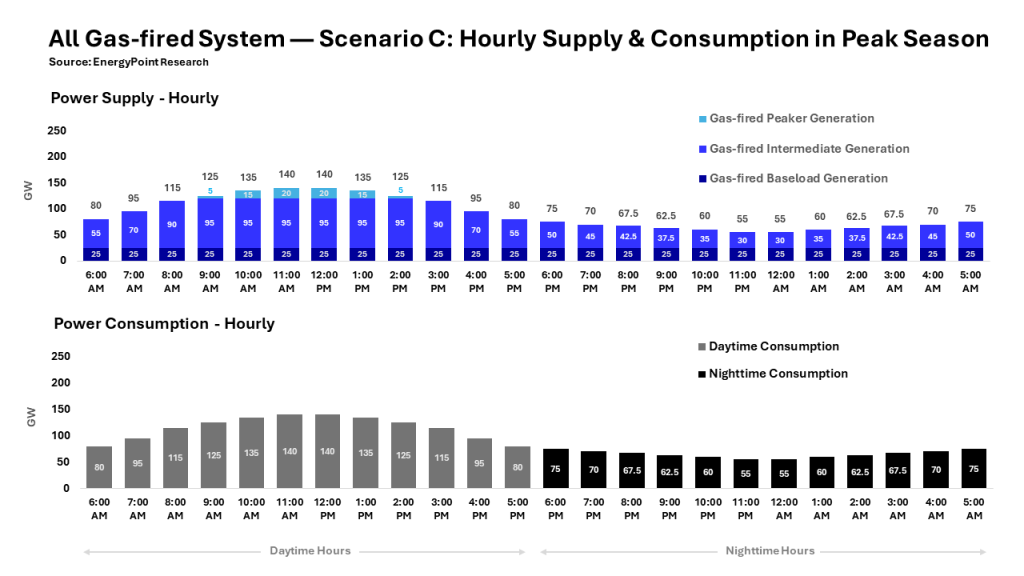
- Peaker—We define peaker demand as the final slice of demand on the system. It is needed no more than 6 hours per day. Peaker plants on the system always operate from 9 AM to 2 PM, a simplifying feature of our grid.
- Intermediate—We define intermediate demand as that slice of demand served by neither baseload nor peaker capacity. In most scenarios, it’s the largest source of power generation, both in terms of capacity and MWhrs produced. Across scenarios, intermediate demand exists an average of 18 hours per day, rising to as high as 24 hours per day during peak season. It falls to as low as 14 hours per day during off-peak season.
- Baseload—We define baseload demand as that which exists on the system 24 hours a day, 365 days per year. Baseload capacity is the level of capacity needed to service year-round baseload demand without assistance from either intermediate- or peaker-class generating capacity.
- All assets on the hypothetical system across all scenarios are assumed to be unsubsidized and newbuild in nature.
Note—See footnotes 1 and 2 for more detail on cost and operating characteristics of the grid and its assets, including each class of generating plant.
Scenario A—Baseline
We start by running the model under idealized “Scenario A” conditions. This scenario allows us to identify a floor for what the breakeven cost could be for a fully gas-fired grid, as unrealistic as it may seem. With this “baseline” in place, we’ll then incrementally add real-world conditions and track the change in breakeven along the way.
Modeling the system in this manner also allows us to isolate what it would take for gas-fired generation to power an entire grid. That is, we can better understand which real-world conditions have the greatest impact on the breakeven cost of the system.
We settle on a grid with annual system demand of 657 TWhrs per year. This is about 50% more power than was consumed in Texas in 2023.
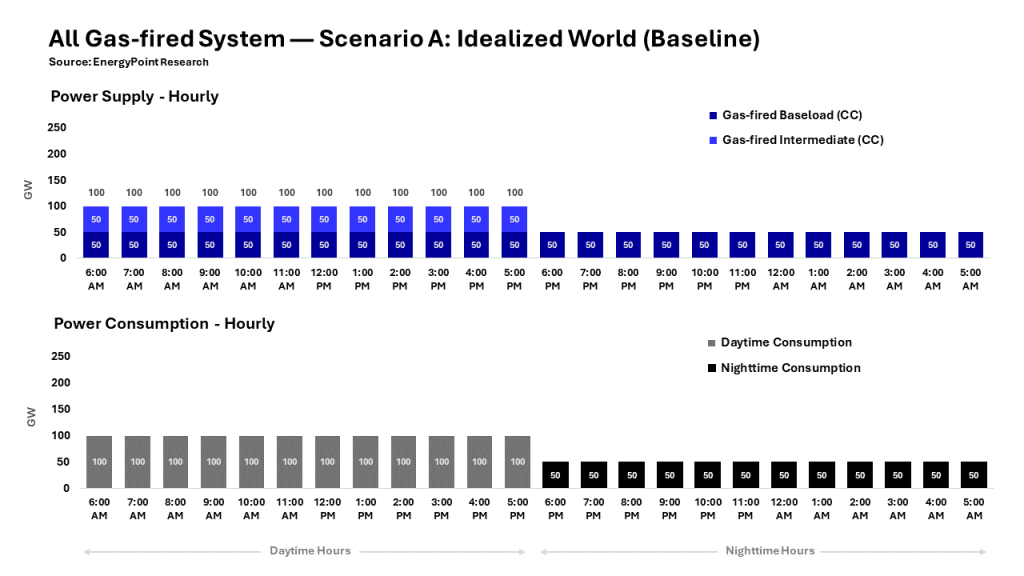
In our most simplified Scenario A, annual daytime demand is 100GW and nighttime demand is 50 GW. This is the case every day of every year. See footnote 10-A for a visual depiction of system demand under Scenario A.
We assume gas-fired generation capacity totals 100 GW, the exact amount required to meet daytime demand. The capacity is comprised of 50 GW of baseload generation to service the system’s 50 GW baseload demand all 24 hours of each day.
Another 50 GW of intermediate generation services the additional 50 GW of demand during daytime hours. There is no peaker capacity needed or installed on the system in this scenario.
Construction costs of the system’s gas-fired capacity range from $950,000 to 1,100,000 per MW of capacity. We assume all plants can be financed at a favorable 7.00% pre-tax weighted-average-cost-of-capital (WACC). Annual inflation is assumed to be 2.00%.
Average inlet gas costs over the life of the project are assumed to range from $2.75 to $3.25 per MMBtu (in 2024 terms) depending on the type of plant. Similarly, heat rates range from 6,500 to 9,000 MMBtus per KWhr depending on plant type.
Finally, non-fuel variable O&M and maintenance capex is assumed to range from $3.50 to $4.00 per MWhr depending on the plant type. No fixed O&M is assumed to exist at this stage of the analysis.
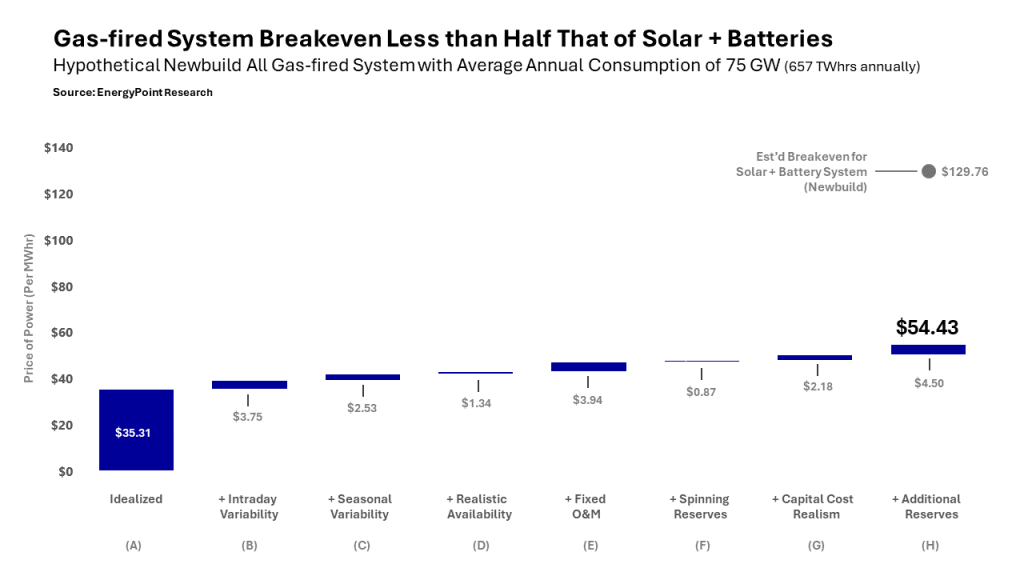
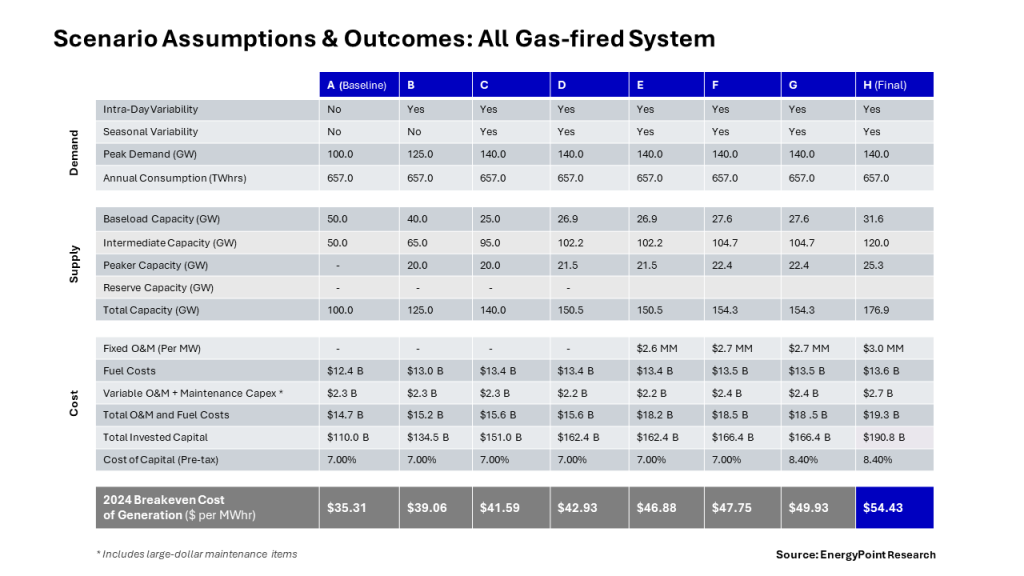
All totaled, the breakeven for Scenario A comes to $35.31 per MWhr.
Note—See the footnote section for more details on our full range of assumptions across all scenarios.
While the idea of the system generating power at below $40 per MWhr is exciting, it’s not realistic. We must begin layering in real-world assumptions to create the conditions we might see in a natural gas producing region of the US. These conditions, and their ensuing costs, are summarized in the scenarios below.
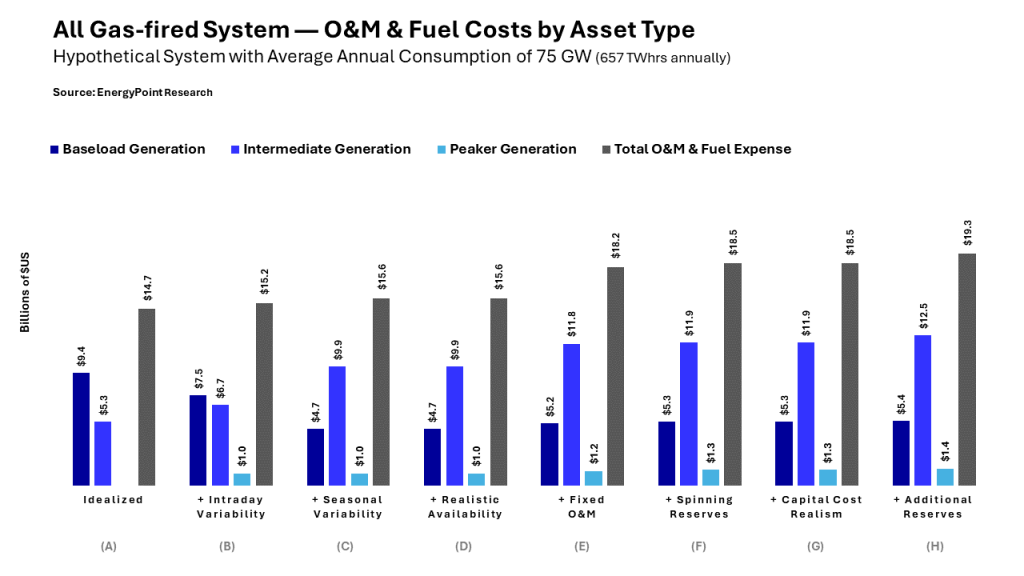
Scenario B — Intraday variability, or the kind of basic hourly change in consumption that occurs on virtually all systems, as households and businesses ramp up—and then ramp down—their activities each day is now added to the system. It adds $3.75 per MWhr to the breakeven cost.
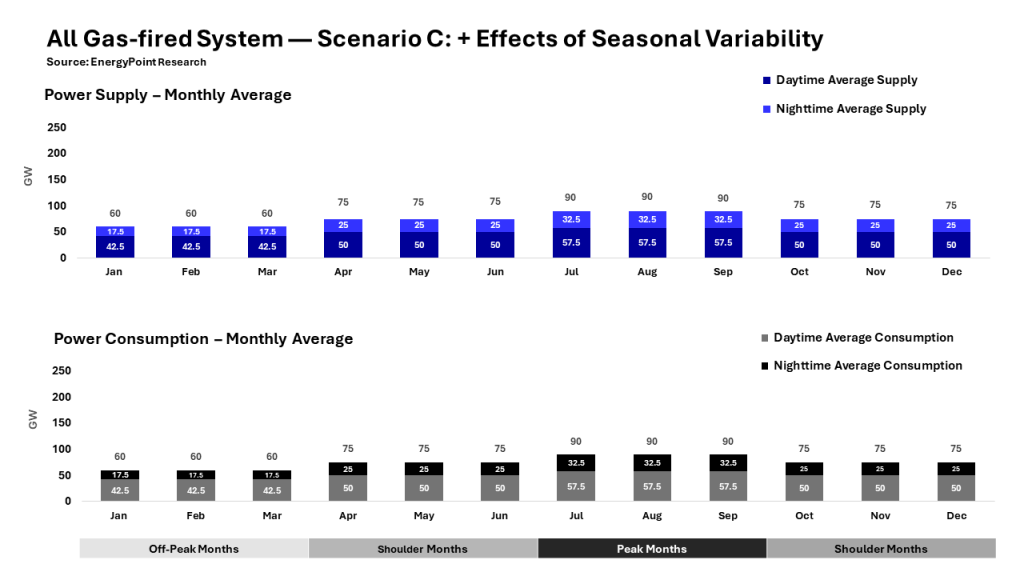
Scenario C — Seasonal variability, or higher than average consumption in the “peak” months of the year and lower than average consumption in the “off-peak” months is introduced. Specifically, we assume summer demand increases by 15 GW and winter demand falls by 15 GW. The remaining months see no change in consumption. The seasonal imbalance adds another $2.53 to the breakeven.
Scenario D — Realistic availability assumptions for plants are also needed. The 100% currently assumed isn’t appropriate since a certain percentage of the time generating capacity isn’t fully available. This can be due to planned or unscheduled maintenance that takes a plant down entirely or partially. It can also be due to factors such as high ambient temperatures or grid constraints limiting the ability of a plant to dispatch. To adjust for these realities, we now assume that, at any given time, 7% of the system’s generating capacity is unavailable for one reason or another. This applies to all classes of generation—baseload, intermediate and peaker. The change adds $1.34 to the breakeven.
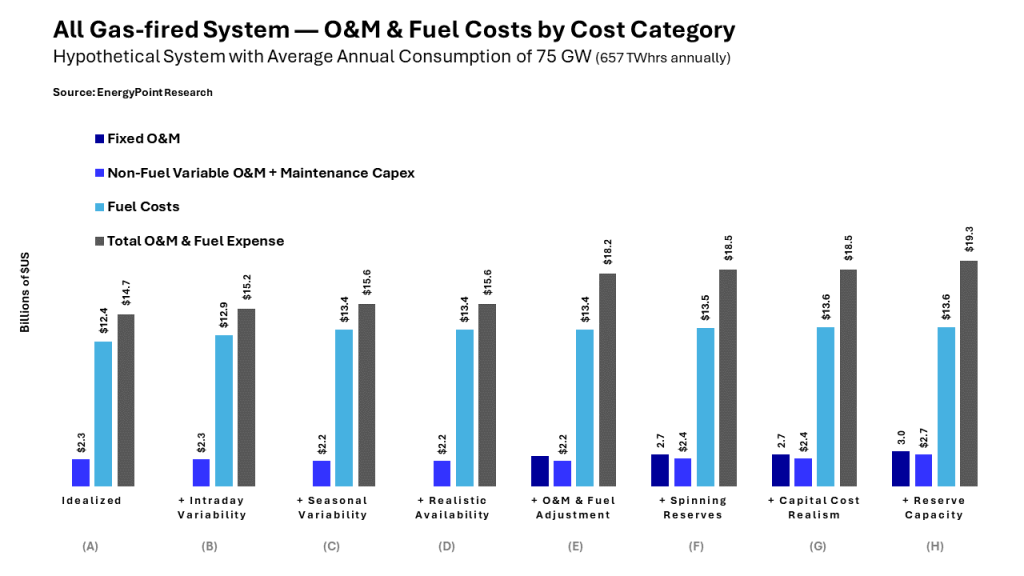
Scenario E — O&M included on the system has so far been limited to plant fuel and non-fuel variable O&M and maintenance capex, including large maintenance items. In this scenario, we add the fixed O&M (FOM) required to keep plants in proper condition regardless of their utilization. FOM adds $3.94 per MWhr to the breakeven.
Scenario F — Spinning reserves are used by grid administrators to ensure system reliability in the case of jolts to either supply or demand. They are also used for system-balancing purposes. In this scenario, we add these additional assets and the economic effects of the additional costs of these reserves. Spinning reserves are assumed to total 5% of the amount of dispatched energy generated on the system. Spinning reserves add $0.87 per MWhr to the system breakeven.
Scenario G — So far, we’ve assumed lenders and investors will fund our system with a pre-tax weighted-average-cost-of-capital (WACC) of 7.00%. This is very likely far too low. In this scenario, we raise the cost of capital to a more realistic 8.40%. This is about the lowest we can justify, and the same as for the PV-hybrid grid. The system breakeven rises by $2.18 per MWhr.
Scenario H — Total system reserves, or spare capacity, are an important part of a well-functioning grid. We target a total reserve margin of 17.5%. After backing out spinning reserves, non-spinning reserves add $4.50 per MWhr to the breakeven. This pushes final gas-fired generating capacity to 176.9 GW and the final system breakeven to $53.43 per MWhr.
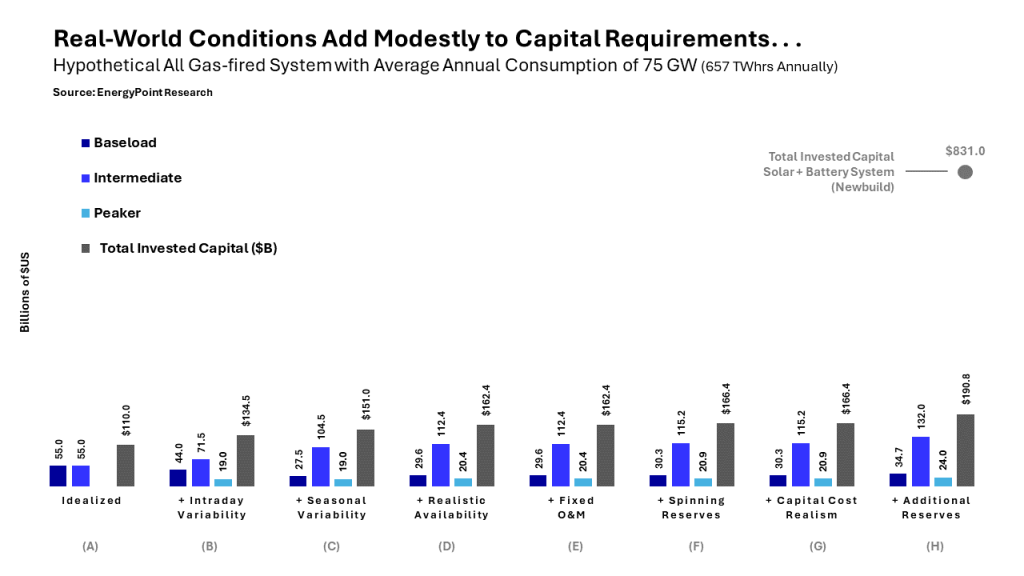
We note that adding the real-world conditions alter the system’s capacity requirements, capital investment and operational efficiencies significantly compared to the idealized baseline (see below). However, the changes are relatively modest compared the PV-hybrid system, which required a more than two-fold increase in capital investment.
- Required gas-fired generation capacity rises from 100.0 GW to 166.3 GW… an increase of 66.3%
- Total invested capital increases 60%… from $110.0 to $176.9 billion
- The average capacity factor across the system falls from 75.0% to 42.4%
Conclusion
When real-world conditions are factored in, the all-gas-fired system’s breakeven rises to $54.43 per MWhr. This is 54.1% higher than that of the idealized system, and 58.1% below the breakeven for the same grid powered by PV-hybrid assets. The relatively modest decline of the all gas-fired system’s capacity factors across scenarios helps explain the cost advantage of the gas-fired system.
Some might argue these findings are irrelevant since there are few if any experts currently pushing for single-fuel source grids. We disagree. First, we’d argue that an undiversified gas-fired grid located in regions with ample natural gas resources and production—like Texas and other Gulf Coast states, and the region of Appalachia—may very well be a better solution than the same grid powered by more expensive and unreliable forms of generation.
Second is the implication these findings have on the claims by so many that solar energy is the cheapest form of electricity. If so, why is that a grid powered solely by newbuild solar—without subsidies or backup from dispatchable thermal plants—has a breakeven almost two-and-a-half times more expensive than the same grid powered exclusively by natural gas? It’s a fair question to ask, one that deserves a conclusive answer.
In the meantime, the analyses we’ve conducted so far, while not conclusive either on their own or in combination, at the very least suggest that in practical terms solar power is not really cheap at all—and may in fact be the most expensive mainstream power source out there. Yes, solar works when the sun is shining, but it’s costly and problematic when the sun fades.
As renewable energy penetration rates rise globally, policymakers and the public should reconsider the policies being pursued. The stakes are too high to continue deceiving ourselves about solar and wind energy, especially in regions with ample natural gas. When its low costs, reliability and flexibility are factored in, gas-fired generation might be unsurpassed as a preferred power source.
Footnotes
1. General Assumptions & Inputs
A) Total annual demand on the system doesn’t change across scenarios, only the shape of demand. Regardless of the scenario, average annual demand remains 75 GW, or 657 TWhrs per year.
B) The breakeven cost of generation is the average price of generated power needed over 20 years to match investors’ return expectations after paying all construction, operating and financing costs. All breakevens are expressed in 2024 US dollars per MWhr.
C) Capacity factors of generating assets measure actual output relative to the maximum potential of an asset over time. Factors of 70% or higher usually connote less flexible but more efficient base-load operations. Factors of 15% or below are common for peaking assets with quick-start capabilities and less efficient operations. Capacity factors, efficiencies and flexibilities of intermediate services fall between those of baseload and peaker.
D) Plant expenses include capitalized construction costs, fuel expense and O&M expense. For baseload plants, these costs are typically higher per unit of capacity and lower per unit of output. For peaker plants, they are typically lower per unit of capacity and higher per unit of output. Intermediate plant costs are typically similar to or slightly below that of baseload on a per-unit of capacity basis, and slightly above that of baseload on a per-unit of output basis.
2. Scenario A: Baseline System
A) In this idealized, or baseline, Scenario, the demand profile of the grid is intentionally simple, with flat daytime consumption of 100 GW and flat nighttime consumption of 50 GW. This equates to average generation of 75 GW per day. This pattern and level of demand recurs daily without variation in this scenario. See footnote 10-A for graphical representation of baseline hourly power consumption.
B) All baseload capacity at this stage is assumed to operate with a perfect capacity factor of 100% over the 20-year life of the plants (i.e., there is no downtime of any type). The intermediate generation operates at exactly a 50% capacity factor, reflecting perfectly reliable operations during the 12 hours of daylight each day for 20 years. The combination of the two results in a system-wide capacity factor of 75%.
C) Baseload generation is assumed to cost $1,100,000 per MW, have a heat rate of 6,500 Btu per KWhr over the life of the project, and pay a flat rate of $2.75 per MMBtu for inlet gas in the first year with the price increasing 2% annually. Intermediate generation is also assumed to cost $1,100,000 per MW, generate at a heat rate of 7,000 Btu per KWhr, and pay a flat rate of $3.00 per MMBtu for inlet gas. Peaker plant construction costs are assumed at $950,000 per MW, with heat rates of 9,500 Btu per KWhr and inlet gas costs of $3.25 per MMBtu.
D) This baseline scenario also includes non-fuel variable O&M + maintenance capex costs. These are estimated at $3.50 per MWhr for baseload generation and $3.30 per MWhr for intermediate generation. Although not employed in this scenario, the estimate for peaker generation is $4.00 per MWhr. The scenario assumes no fixed costs at this point.
3. Scenario B: Adding Intraday Variability
A) In the real world, demand for energy isn’t constant. Society almost always uses more power during the hours of the day and less during nighttime hours. We adjust for these realities in Scenario B.
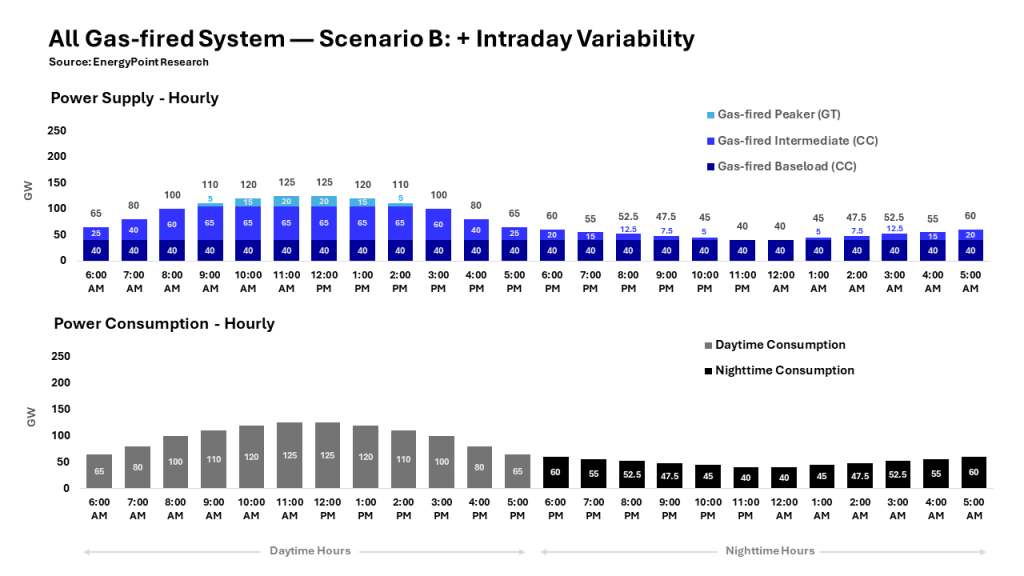
B) Rather than coming online at 100 GW at 6 AM as in Scenario A, daytime demand in Scenario B begins at 65 GW at 6 AM and rises to a peak of 125 GW by 11 AM. It remains at 125 GW for two hours. At 1 PM, demand begins to drift lower, bottoming at 65 GW by 5 PM. Total daytime consumption of 1,200 GWhrs does not change.
C) Nighttime demand now begins at 60 GW in the 6 PM hour, and then drifts to its daily low of 40 GW by 11 PM, where it holds for two hours. Demand then drifts upwards beginning at 1 AM, reaching 60 GW in the 5 AM hour. Total nighttime consumption remains 600 GWhrs. These patterns repeat each day, every day. See footnote 10-B for more information on Scenario B’s daytime supply and demand profile with intraday variability.
D) The system’s challenge in Scenario B is to handle a variable daytime demand peak of 125 GW, up from 100 GW in Scenario A. To accommodate this peak, total plant capacity rises exactly to 125.0 GW. This pushes total capital investment to $134.5B, up from $110.0B in Scenario A. The average capacity factor of generating capacity on the system drops from 75% to 60%.
4. Scenario C: Adding Seasonal Variability
A) It’s almost always the case that grids have certain times of the year in which demand is higher than average, and other times in which demand is lower than average. We refer to these differences as seasonal variability. In Scenario C, we assume summer is the peak season with the daily and monthly peaks driven by increased use of air conditioning to keep homes and businesses cool. Winter is the off-peak season.
B) Specifically, in the peak months of July, August, and September, Scenario C assumes average daily demand rises by 15 GW to 90 GW, up from 75 GW in Scenario B. Conversely, in the off-peak months of January, February and March, demand declines 15 GW to 60 GW. The remaining “shoulder months” experience no change in demand, which remains at 75 GW. See footnotes 10-C and 10-D for graphical representations of monthly and hourly power consumption on the grid after adding seasonal variability.
C) Adding seasonality to the grid has real implications. For one, the grid now needs more generating capacity to handle the higher demand in peak months. This is the case even though it means more capacity than needed during the remaining nine months of the year (a situation not unique to all gas-fired systems). In Scenario C, peak hourly demand rises to 140.0 GW from 125.0 GW. It also changes the generating mix on the system, pushing year-round baseload capacity down from 40 GW in the prior scenario to 25 GW and intermediate capacity up from 65 GW to 95 GW. See footnotes 10-C and 10-D for graphical representations of monthly and hourly power consumption on the grid after adding seasonal variability.
D) Total capital costs increase from $134.5B to $151.0B due to seasonal variability. Since capacities have risen even as annual demand hasn’t changed, the average plant capacity factor falls from 60.0% to 53.6%. The decline reflects the fact that extra generating capacity needed to meet demand during the system’s three-month peak season is an efficiency burden in the other nine months.
5. Scenario D: Availability Adjustment
A) We’ve so far assumed 100% of the system’s generation capacity is available as when it’s needed. This isn’t realistic. We now reduce availability to 93% for all plant types. The net result is to increase the system’s required gross capacity. See below.
B) To calculate the new gross capacities due to reduced availablity, we take current capacity and divide it by the availability factor of 0.93. This pushes total capacity from 140.0 to 150.5 GW (140 / 0.93). Baseload rises from 25.0 to 26.9 GW, intermediate from 95 to 102.2 GW, and peaker from 20.0 GW to 21.5 GW.
C) Required investment in capacity rises $11.4 billion to $162.4 billion. The average capacity factor across the plants falls to 49.8%.
6. Scenario E: Adding Fixed O&M
A) For our purposes, fixed O&M (FOM) includes plant operating labor, maintenance, property taxes, and other expenses that must be paid regardless of a plant’s run time. Based on our research, we assume FOM of $20 per KW of capacity for baseload, $18 for intermediate, and $10 for peaker plants. The addition of FOM has no effect on the system’s capacity factor, which remains at 49.8%.
7. Scenario F: Adding Spinning Reserves
A) While spinning reserves are typically expressed in terms of the combined gross capacities of the assets that are “spinning,” it’s not appropriate the assume these assets incur the same variable costs as if they were operating at higher capacities. Specifically, we assume spinning assets operate at just 10% of their maximum operating levels. Both fuel and other variable costs are pegged to this rate of operation
B) Although a minor point, for capacity calculations of spinning reserves we assume an availability factor of 100% rather than 93%, We do so because gross reserve capacity targeted in the final Scenario H is pegged off of 93% availability. Our intent is to avoid overstating the required amount of capacity by double-counting the availability factor.
8. Scenario G: Adding Realistic Cost of Capital
A) In Scenario G, we adjust the assumed pre-tax cost of capital from 7.00% to something more realistic. But let’s first clarify what we mean by the cost of capital. In short, it’s the pre-tax weighted average cost of capital (WACC) of the asset. Based on the principles of the Capital Asset Pricing Model (CAPM), it captures the total cost of capital from all sources needed to finance the system’s construction and operation. It includes all forms of debt and equity. Simply put, WACC is the average rate the project pays its lenders and investors. It also serves as the minimum unlevered pre-tax return, or “hurdle” rate, investors require from the project.
B) Setting a practical WACC begins with determining a capital structure. As in the analysis of a PV-hybrid system, we assume a system of this size can be optimally funded with 60% non-recourse debt. The remaining 40% is equity.
C) For the interest rate on the debt portion of the financing, we look to 20-year US Treasury bonds—the life of the project. In the summer of 2024, such bonds traded at 4.50%. We assume a 75 basis-point risk premium. This gets us 5.25% as the debt rate. We assume equity investors expect a 10% annual return over the project’s 20-year lifespan.
D) After applying weightings of 60% and 40%, our debt and equity rate assumptions produce an after-tax WACC of 7.15%. If we assume the project’s pre-tax cash flows are reduced by 15% after taxes, this produces a pre-tax WACC of 8.41% (7.15% / 0.85). We round to 8.40%.
9. Scenario H: Adding Additional Reserves
A) Reserves on a grid include all reserve types on a system, including the spinning reserves we added in Scenario F. Grid reserve margins are calculated by subtracting peak demand from the peak total supply at peak demand, and dividing it by peak demand.
B) Electricity grids with reserve margins of less than 15% are considered tight, while margins greater than 20% typically connote oversupply. We split the difference and assume a 17.5%, which adds a gross 26.3 GW of gas-fired capacity to the grid. After backing out the spinning reserves already added in the prior scenario, Scenario H reflects the incremental step of adding non-spinning “standby” reserves of 22.6 GW.
C) We assume the mix of asset types making up standby reserves mirrors the mix of both spinning and dispatching generation. This results in standby capacity comprised of 4.0 GW of baseload, 15.3 GW of intermediate, and 3.2 GW of peaker capacity. All totaled, standby capacity adds an incremental $24.4B in capital costs, and brings total system reserves to 26.3 GW.
D) We assume on average standby generation runs one-half day per month, or six full days (144 hours) per year, for one reason or another. Resulting operating costs of standby assets (including fuel) are relatively small at $860.0 million, split roughly half between variable and fixed O&M. This is about a third of what would be incurred if these same assets were part of the day-to-day operating fleet.
10. Tables & Charts
A) Chart 3: Scenario A Supply & Demand (Baseline)
B) Chart 4: Scenario B Supply & Demand
C) Chart 5: Scenario C: Monthly Supply & Demand
D) Chart 6: Scenario C: Hourly Supply & Demand
E) Chart 7: O&M and Fuel Costs by Asset Types
F) Chart 8: O&M and Fuel Costs by Cost Type
G) Table 1: Summary of Assumptions & Outcomes by Scenario


There seems to be an error in Scenario A—Baseline
“Average inlet gas costs over the life of the project are assumed to range from $2.75 to $3.25 per MMBtu (in 2024 terms) depending on the type of plant. Similarly, heat rates range from 6,500 to 9,000 MMBtus per KWhr depending on plant type.”
Perhaps you meant “6,500 to 9,000 Btus per KWhr”
Yes, there was some lack of clarity in the wording on that section. It’s now been changed to be more clear. Thank you for pointing this out.