We’re publishing a series of posts examining the viability of unsubsidized renewable energy. The goal of the series is simple—to discern fact from fiction. In the process, we expect to challenge core assumptions underpinning the renewables-centric energy policies of many Western nations.
This post is the first in the series. It seeks to answer a simple question: Is solar the “cheapest” form of energy of our time, as solar proponents and the media report so assertively and so often?
To answer, the post examines the costs of an emissions-free grid consisting exclusively of solar panels and battery energy storage systems (BESS). In our opinion, its findings—supported by pragmatic analysis—show that modern economies cannot afford to rely on such a grid.
Solar As Savior
The inspiration for this particular analysis didn’t materialize out of thin air. A rising tide of clean energy enthusiasts now claim that zero-emissions solar energy is the most affordable electricity on the planet. It’s this assertion that compelled us to perform the analysis.
Consider examples of these claims from consultants, government agencies and the vaunted national press—none of whom provide support with detailed calculations:
Solar photovoltaic is now the lowest-cost source of electricity in most places around the world.

— The Conference Board, February 21, 2024

A report from Ernst & Young shows that despite inflationary pressures, solar remains the cheapest source of new-build electricity.

— PV Magazine, December 8, 2023

Solar is now the cheapest electricity in history, confirms the International Energy Agency

— Carbon Brief, October 13, 2020
The Rocky Mountain Institute… calculates that the cost of a kilowatt-hour of battery storage has fallen by 99% over the past 30 years.

— The Economist, June 20, 2024

Batteries are quickly moving from… niche applications to shifting large amounts of renewable energy toward peak demand periods.

— Helen Kou of BloombergNEF, New York Times, May 7, 2024

If you want more renewables on the grid, you need more batteries.

— Andrés Gluski, CEO of AES, New York Times, May 7, 2024
Support for solar energy in the US is nothing new. Both political parties have backed it and wind energy for decades, with federal subsidies like the investment tax credit (ITC) and production tax credit (PTC) fueling development. The Inflation Reduction Act (IRA), passed in August 2022, extended both the ITC and the PTC.
Individual states also offer renewables developers and investors additional incentives like property tax breaks, grants, and low-interest loans. Many states and municipalities also have their own renewable energy mandates.
Enthusiasm around the 2015 Paris Agreement further spurred investment in green technology. Much of the US spending went to wind and solar, which were seen as lower-risk and more mature technologies. They would save us from the environmental impacts of fossil fuels, it went.
While these and other important factors have contributed to the rise of both renewables and batteries, the inspiration for solar’s titular status as the “world’s cheapest” electricity seems to stem mostly from the falling costs of Chinese-made solar panels. In some circles, this blare goes unchallenged as conventional wisdom.
But are these claims legit? Yes, panel and battery costs have plummeted since 2010—in some cases by as much as 85%. But cheaper panels alone don’t equate to cheap power. Other factors matter, too.
Fortunately, we’re not in the dark when it comes to evaluating the cost of renewables. After years of observation, we know a lot about what drives their performance and costs—even if the media hasn’t caught on.
For example, we know that the average output of renewables is about 25% of their nominal, or nameplate, capacities in any given year. To put that in perspective, baseload natural gas and coal plants produce at about 75%. We also know that as more renewables flood our grids, these low capacity factors pose a risk to reliability.
To address the issue of reliability, some propose spending broadly on all types of energy technologies. Advocates call this the “all the above” or “energy diversity” strategy. But investing in all forms of energy simply because they exist is wasteful and pointless. After all, shouldn’t energy forms also be cost-effective and abundant?
As it happens, a competing approach—one even more popular in green circles—has emerged. It’s to go “all in” on supposedly low-cost solar. As the argument goes, solar power is affordable, abundant and clean. And if we move quickly to this wonder source, with the help of BESS, we can save both money and the planet.
But there are big problems with these assertions.
For one, as we’ve already hinted, those making them—and the media repeating them—are confusing falling costs of certain solar components with the total cost of solar generation. The truth is panels are now a relatively small portion of the overall cost of utility-scale solar installations. The same is true when it comes to battery packs and the total cost of BESS.
Imagine lumber prices plummeting 80% and the housing industry insisting that housing costs have dropped at a similar rate. Who would believe such an outlandish claim when so much of the cost of a new home is in things like land, labor, HVAC, wiring, plumbing, concrete, interior trim, exterior trim and facades, landscaping, insurance, permitting and financing? Yet, this is exactly what renewable energy advocates want us to believe when it comes to the all-in costs of solar and BESS installations on our grids.
Another sleight of hand from the “solar as a savior” crowd is the implication that the sometimes very low cost of solar energy—for example, in the midday hours of a clear summer day—can be the cost of solar power over 24 hours, day in and day out. This is clearly not the case.
The truth is solar power’s lack of reliability makes it a risky bet for meeting a modern society’s always-on energy needs. A working energy system needs more than just stacks of solar panels. Expensive batteries, substantial public funding, and forever doses of luck are also essential for it to all work as needed.
Testing Solar + BESS
The good news is with a bit of work we can test the claim that solar is in fact today’s cheapest course of electricity.
One obvious way to get a handle on the true cost of solar energy is to calculate the all-in cost of electricity for a hypothetical grid powered exclusively by unsubsidized utility-scale solar panels and BESS. Such a grid is called a “PV-hybrid.” Modeling it allows us to understand the cost of solar power when it’s unsupported by the availability of other power sources.
When modeling a PV-hybrid system, there are some basic rules to remember:
- Every electron consumed on the grid is the product of sunlight hitting a solar panel. This includes electricity generated during the day, stored in BESS and later dispatched to serve nighttime demand. There are no power imports on the system of any kind.
- Since solar panels can only produce when the sun is shining, only the system’s installed BESS can meet nighttime power consumption. There are no other options.
- As with any grid, the level, timing and duration of peak consumption on the system plays a major role in determining the system’s ultimate configuration. That is, we must design the system to, among other things, reliably meet peak demand.
- To properly compare costs, the system’s design must achieve the same reliability standards as today’s grids.
- All assets on the hypothetical system across all scenarios are unsubsidized and newbuild assets.
Our first step in the analysis is to determine the cost of solar energy under ideal conditions. This Scenario A allows us to identify the floor for what the breakeven cost of generation could be for our system, as unrealistic as it may be. Once this “baseline” breakeven is established, we’ll then incrementally add various real-world conditions and track the change in breakeven along the way.
Modeling a PV-hybrid system in this manner allows us to isolate what it would take for solar energy to power an entire grid, and understand which conditions in the real world have the greatest impact on the real cost of solar energy and why.
We settle on an idealized grid with annual daytime consumption of 100 GW and nighttime consumption of 50 GW. For context, this is about 50% more power than was consumed in Texas in 2023.
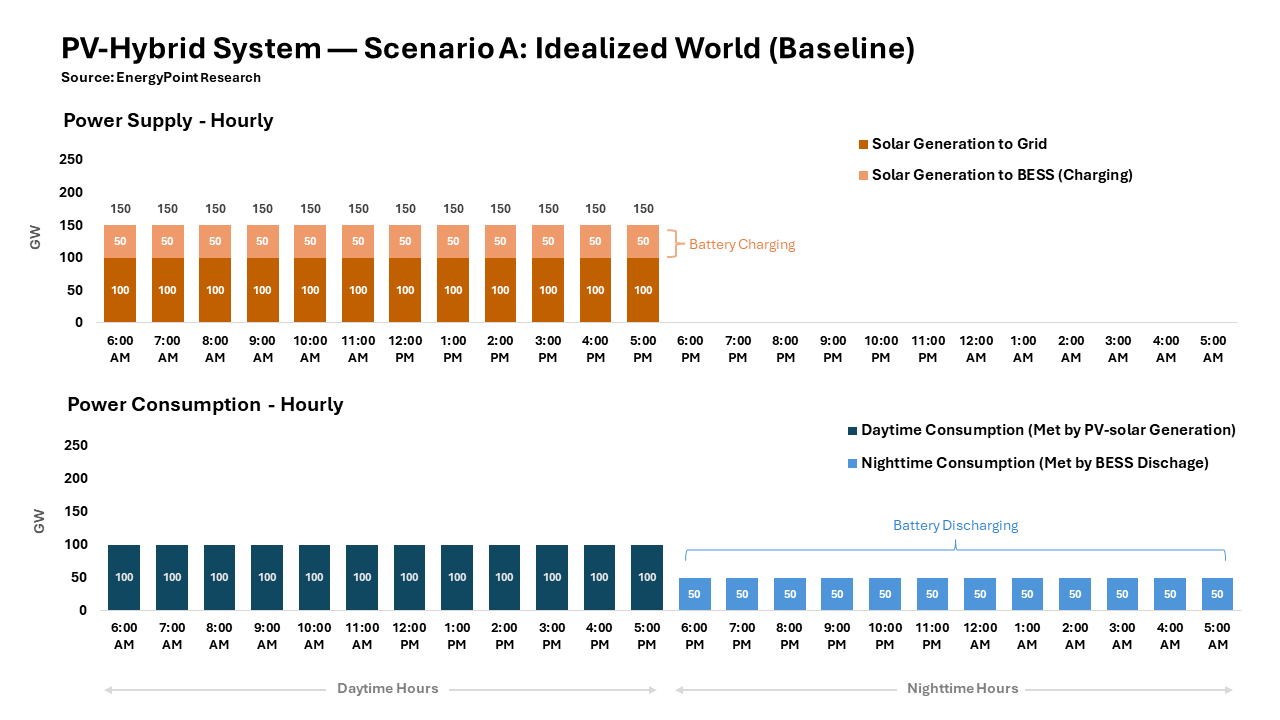
Nature cooperates perfectly. The sun rises and sets like clockwork across the system at 6 AM and 6 PM. There are no clouds and no variability. The sun is always positioned for maximum panel performance during daylight hours. Panels produce a steady flow of daytime energy, and BESS takes care of nighttime demand. Everything works like a dream. See Chart 1 in footnote 10-A for visualization of baseline supply and demand.
Installed panel capacity is 150 GW. This is sufficient to generate both the 100 GW of energy consumed during the day and the 50 GW stored in BESS to serve nighttime demand. Panels are assumed to cost $1MM per MW and have an average lifespan of 20 years. BESS costs are assumed at $3.6 MM per MW for a 12-hour duration with a 15-year lifespan.
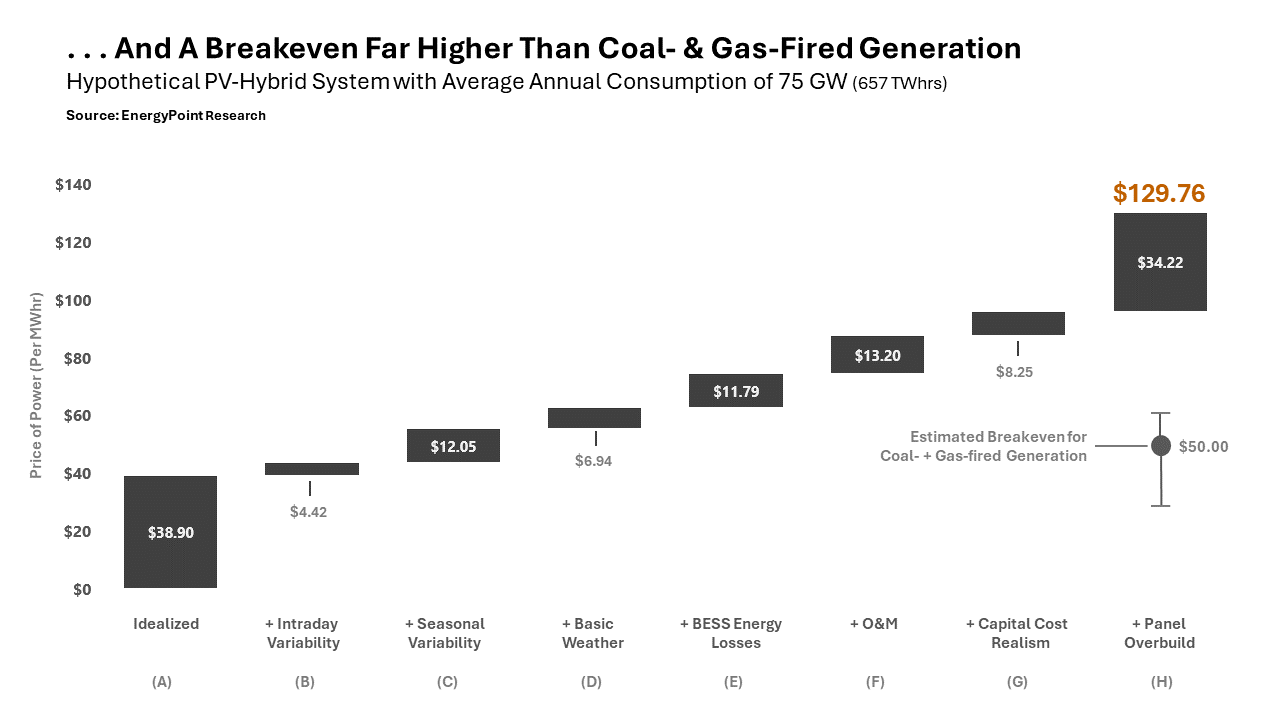
This idealized Scenario A has a breakeven generation cost of $38.90 per MWhr. Note that in the real world the average new gas or coal-fired plant has a breakeven of about $55 per MWhr, with a range of between $30 and $65 per MWhr depending on location, commodity prices and other factors.
Note—See the footnote section for more details on our full range of assumptions across all scenarios.
Of course, the dream of generating at below $40 per MWhr doesn’t last when real-world conditions are systematically added to create the conditions we might see in a typical US Sunbelt state. The ensuing costs are summarized in the scenarios below.
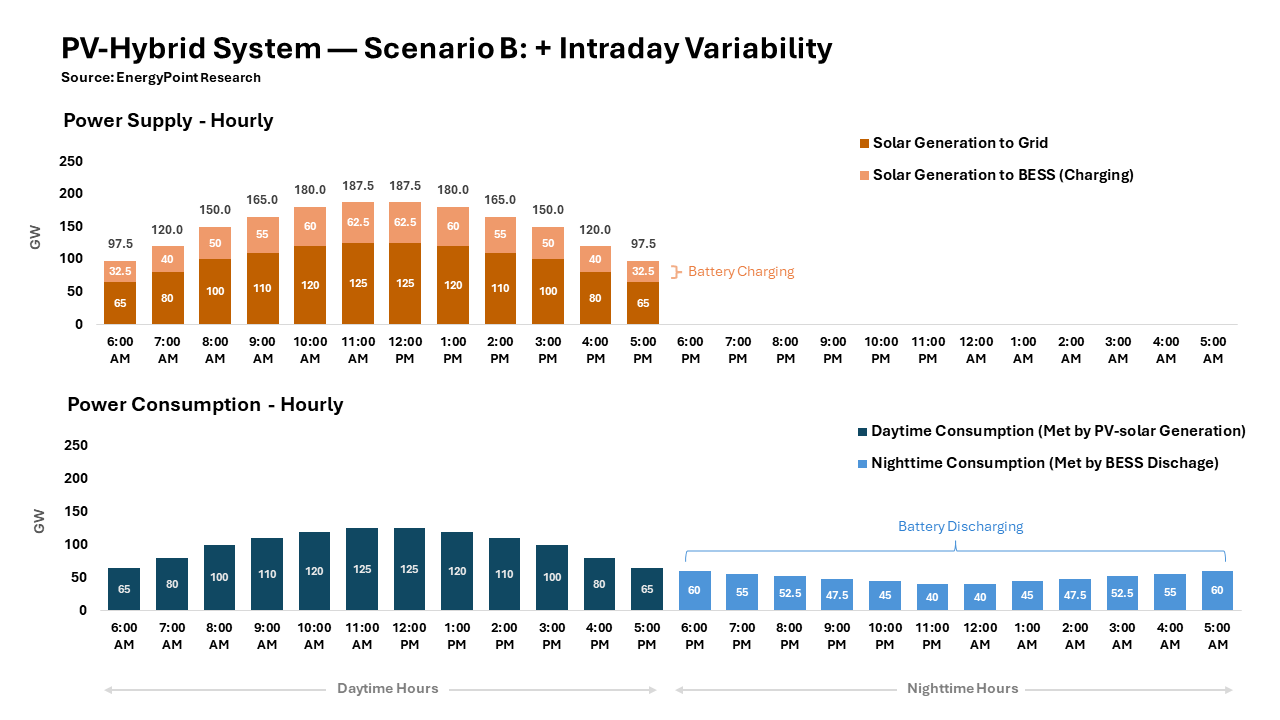
Scenario B — Intraday variability, or the kind of basic hourly change in consumption that occurs on virtually all systems, as households and businesses ramp up—and then ramp down—their activities each day. It adds $4.42 per MWhr to the breakeven cost of the system. See Chart 2 in footnote 10-B for visualization of intraday variability’s effect on supply and demand.
Scenario C — Seasonal variability, or higher than average consumption in the “peak” months of the year and lower than average consumption in the “off-peak” months. Specifically, we assume summer demand increases by 15 GW and winter demand falls by 15 GW. The remaining months show no change. This seasonal imbalance adds another $12.05 to the breakeven as rising capital costs begin to take their toll. See Chart 3 and 4 in footnotes 10-C and 10-D for visualization of supply and demand after incorporating seasonality.
Scenario D — Basic weather in the form of periodic clouds, rain and snow. These conditions reduce the amount of sunlight assumed to hit the system’s panels. The resulting haircut to power production ranges from 30% in the winter months to 20% in the summer. The change adds $6.94 to the breakeven. See Chart 5 in footnote 10-E for the assumptions underlying output reduction factors due to basic weather.
Scenario E — BESS energy losses must also be taken into account. Accordingly, we now assume that batteries discharge 90% of their capacity, down from 100%. We also adjust for the fact that batteries have a standard life of 15 years, compared to the 20 years for solar panels. These adjustments are not trivial and add up fast, boosting the breakeven by $11.79.
Scenario F — All assets and infrastructure have operating and maintenance (O&M) costs. PV-hybrid systems are no exception. So we now add fixed O&M of $25 per kilowatt for panels and $15 per kilowatt for batteries. Both escalate at 2% per year. This adds $13.20 to the breakeven. See footnotes 10-F and 10-G for more detail on fixed O&M assumptions.
Scenario G — Lenders and investors do not realistically hand out debt and equity financing with a pre-tax weighted average cost of capital (WACC) of 7.00%, as we have assumed so far. We raise the WACC to a more realistic 8.40%—about the lowest we can justify. It increases the breakeven by another $8.25 per MWhr.
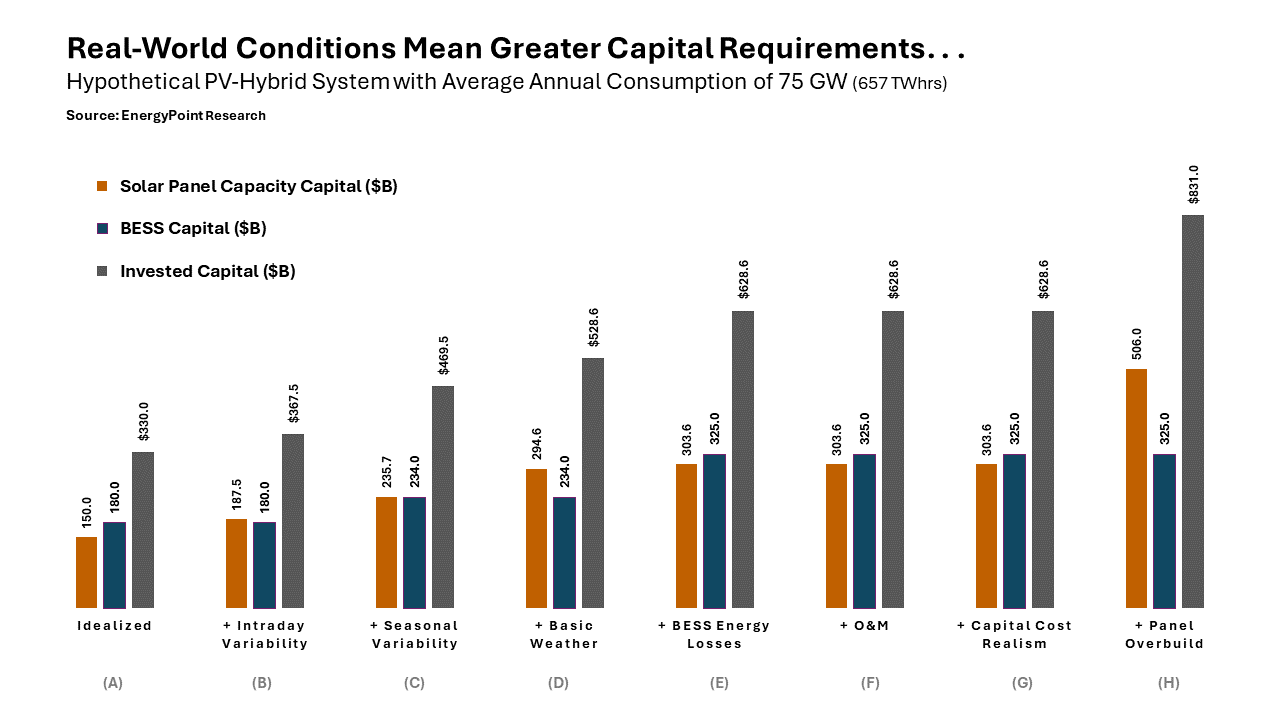
Scenario H — Asset overbuild is required for the system to reliably perform in the real world. That is, the overbuild in panels or BESS ensures no prolonged blackouts in a worst-case scenario. We define worst case as panels receiving only 50% of a clear day’s sunlight for five consecutive days. Analysis shows overbuilding panels is more economic than overbuilding BESS. Even so, the panel overbuild still adds a whopping $34.22 to the breakeven.
These real-world conditions significantly alter the system’s capacity requirements, capital investment, and operational efficiencies. See below.
- Required solar panel capacity rises from 150.0 GW to 506.0 GW… an increase of 237%
- Required battery capacity jumps from 50.0 GW to 72.2 GW… up 44%
- Total invested capital increases 152%… from $330.0 to $831.0 billion
- The capacity factor of panels and BESS fall to 14.9% and 11.5%, respectively
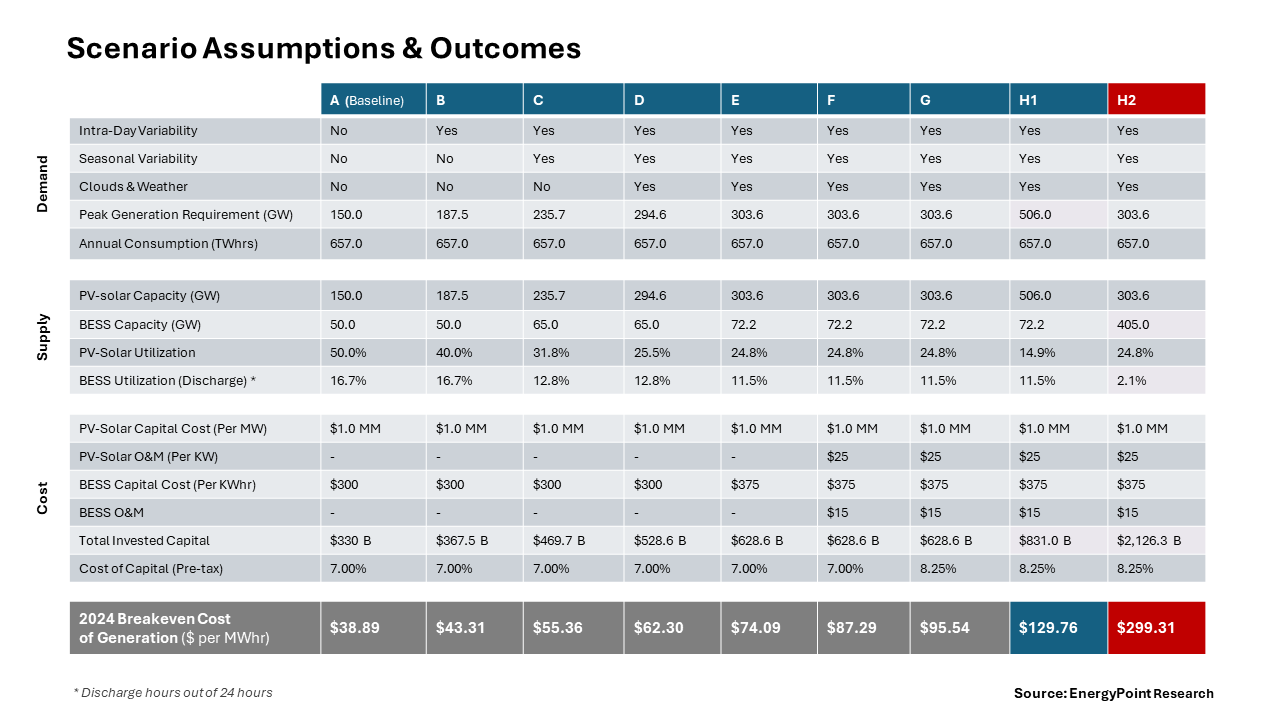
See footnote 10-I for a summary of key inputs and outputs across scenarios.
Conclusion
When real-world conditions are factored in, our PV-hybrid system’s breakeven skyrockets to $129.76 per MWhr—more than three times that of the idealized system and significantly higher than the breakeven for coal and gas-fired generation. The system’s low capacity factors are a clear indicator of its inefficiency.
So we ask, if solar energy is truly the “cheapest” form of electricity, why does a grid powered solely by solar—without subsidies or backup from dispatchable thermal plants—require such an astonishingly high breakeven? The answer lies in the fact that solar power is not really cheap at all. In fact, it may be the most expensive mainstream power source. Yes, it dazzles at first glance. But a deeper and real-world look reveals serious cracks in its story.
Some might argue these findings are irrelevant since there’s few if any currently pushing for large-scale PV-hybrid grids. We disagree. The challenges presented in each increasingly real scenario don’t disappear just because solar may constitute less than 100% of a grid’s assets. Other fuels on the grid may help cloak the cost of solar for a time, but the bill will eventually come due in higher electricity rates or taxes.
As solar and BESS penetration rates rise globally, policymakers and the public need to reconsider how we’re building out our grids. The stakes are too high to continue deceiving ourselves about solar energy. Whether we go all-in, half-in or a quarter-in, any amount of solar adds unwelcome fragility, cost and risk to our energy system. There are better options, including natural gas and nuclear.
Footnotes
1. Additional Assumptions & Inputs
A) The only types of assets on our hypothetical system are unsubsidized utility-scale photovoltaic solar (panels) and battery energy storage systems (BESS). This grid configuration is called a PV-hybrid system.
B) Importantly, total annual demand on the system doesn’t change across scenarios, only the shape of demand. That is, regardless of the scenario, average annual demand remains 75 GW, or 657 TWhrs per year.
C) The breakeven cost of generation is the average price of generated power needed over 20 years to match investors’ return expectations after paying all capital, operating and financing costs. All breakevens are expressed in 2024 US dollars per MWhr.
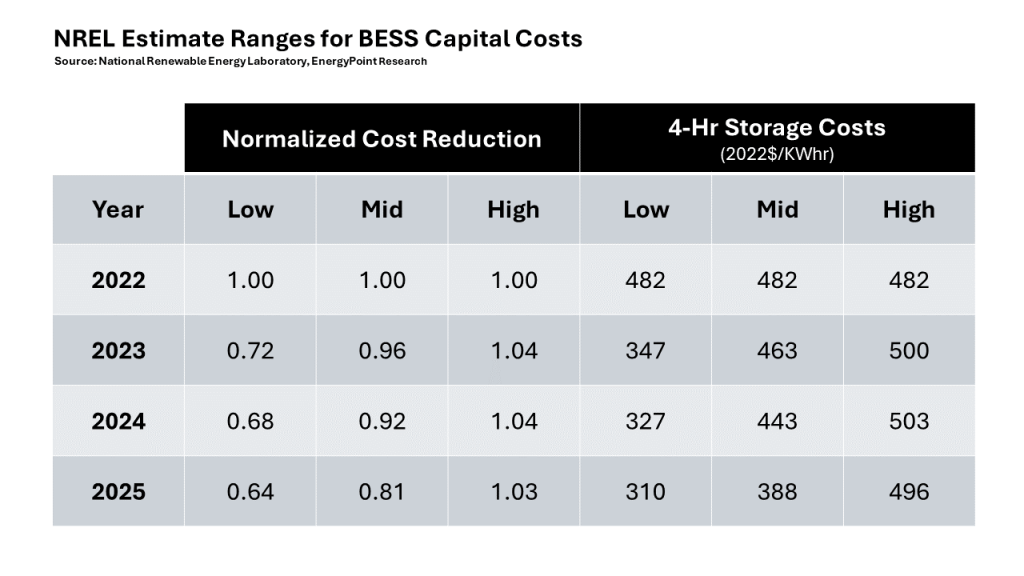
D) Nailing down the capital costs for BESS was a challenge. However, after a thorough search, we found a quality 2023 study by the National Renewable Energy Laboratory (NREL), a unit of the US Department of Energy, that analyzed data from 16 respected sources. The study acknowledges the range of estimates and fast pace of change in costs for BESS. It also recognizes differences in BESS cost elements between studies. For example, one estimate might include inverters, while another might not. In the end, NREL chose a simple average of all 16 estimates for the capital costs of BESS with four-hour duration and 15-year lives. The study also includes O&M estimates for BESS, which we used in Scenario F.
E) Capacity factors of generating assets measure actual output relative to the maximum potential of an asset over time. Factors of 70% or above usually indicate base-load operations. Factors below 15% are common for peaking assets. Intermediate services fall between the two.
2. Scenario A: Baseline System
A) For our ideal or “baseline” system, the sun rises and sets completely and immediately across the system at 6 AM and 6 PM. All days are 100% cloudless, with the sun always positioned for maximum panel output during daylight hours. Power supplied by panels is level at 150 GW during all daytime hours, and zero during nighttime hours. Daytime power consumption is level at 100 GW. Nighttime consumption is half as much at 50 GW. See footnote 10-A for graphical representation of baseline hourly power consumption.
B) Installed solar panel capacity in the baseline scenario is 150 GW. This covers both real-time power consumption and the charging of the BESS during daytime hours. We assume panel capital costs average $1MM per MW and have economic lives of 20 years.
C) Installed BESS capacity in the baseline scenario is 50 GW of 12-hour duration BESS. Capital costs of BESS are assumed to be $300 per KWhr, per estimates by NREL. This is $3.6 MM per MW for a 12-hour duration. The BESS is assumed to have an economic life of 15 years. See footnote 10-H for more detail on BESS capital costs.
D) For the baseline scenario, total system costs are limited to capex and investor returns— ie, neither panels nor BESS incur O&M costs. This requires ignoring the costs of energy leaks, degradation and replacement costs of BESS.
E) We assume a favorable 7.00% as the project’s pre-tax weighted average capital cost (WACC).
F) The resulting capacity factors in the baseline scenario are 50% for the panels and 16.7% for the BESS.
3. Scenario B: Adding Intraday Variability
A) In the real world, demand for energy isn’t constant. People almost always use more power during the day and less at night. And, of course, the sun doesn’t shine all day. We adjust for these realities in Scenario B.
B) Rather than coming online at 100 GW at 6 AM as in Scenario A, daytime demand in Scenario B begins at 65 GW at 6 AM and rises to a peak of 125 GW by 11 AM. Demand remains at 125 GW for two hours. At 1 PM, demand begins to drift lower, bottoming at 65 GW by 5 PM. Total daytime consumption of 1,200 GWhrs does not change. See footnote 10-B for more information on Scenario B’s daytime supply and demand profile with intraday variability.
C) Nighttime demand is also typically variable. In Scenario B it begins at 60 GW in the 6 PM hour, and then drifts to its low of 40 GW by 11 PM where it holds for two hours. It then drifts upwards beginning at 1 AM, reaching 60 GW in the 5 AM hour. Total nighttime consumption remains 600 GWhrs. These patterns repeat each day, every day. See footnote 10-B for graphical representation of hourly power consumption with intraday variability.
D) The system’s challenge in Scenario B is to handle a variable daytime demand peak of 187.5 GW, up from 150 GW in Scenario A. To accommodate this peak, panel capacity rises exactly to 187.5 GW. This pushes total capital investment to $367.5B, up from $330B in Scenario A. The capacity factor of the panels drops to 40%.
E) Note that we generously assume BESS can vary discharge rates as needed to match hourly nighttime demand. This means, since nighttime demand does not change, BESS’s costs and capacity factors in Scenario B don’t change either.
4. Scenario C: Adding Seasonal Variability
A) It’s almost always the case that grids have certain times of the year in which demand is higher than average, and other times in which demand is lower than average. We refer to these differences as seasonal variability. In Scenario C, we assume summer is the peak season, with the daily and monthly peaks driven by increased use of air conditioning to keep homes and businesses cool. Winter is the off-peak season.
B) Specifically, in the peak months of July, August, and September, Scenario C assumes average daily demand rises by 15 GW to 90 GW, up from 75 GW in Scenario B. Conversely, in the off-peak months of January, February and March, demand declines 15 GW to 60 GW. The remaining “shoulder months” experience no change in demand, which remains at 75 GW. See footnotes 10-C and 10-D for graphical representations of monthly and hourly power consumption on the grid after adding seasonal variability.
C) Adding seasonality to the grid has big implications. For one, the grid now needs more solar panel capacity to handle the higher demand in peak months. This is the case even though it means more capacity than needed during the remaining nine months of the year (a situation not unique to PV-hybrid systems).
D) Peak hourly demand (ie, daytime consumption plus daytime BESS charging) rises to 235.7 GW from 187.5 GW before adding seasonality. Thus, this 235.7 GW is now the system’s required panel capacity. Furthermore, the system also needs 15 GW more BESS to serve evening demand in the peak months, which has also risen by 15 GW. This brings total installed BESS capacity to 65 GW. See footnotes 10-C and 10-D for graphical representations of monthly and hourly power consumption on the grid after adding seasonal variability.
E) Total capital costs increase from $367.5B to $469.7B due to seasonal variability. Since capacities have risen even as annual demand hasn’t changed, capacity factors fall from 40.0% to 31.8% for panels and from 16.6% to 12.8% for BESS. Both declines reflect the fact that the extra panel and BESS capacity needed to meet peak demand in the three-month peak season is an efficiency burden the other nine months.
5. Scenario D: Adding Basic Weather
A) Anyone who lives outside the desert understands weather won’t always cooperate with the needs of a PV-hybrid system. Clouds, rain and snow are all part of Earth’s climate and must be accounted for, as they reduce the ability of a PV-hybrid system to generate reliable energy.
B) In Scenario D, the amount of sunlight hitting panels changes as the weather changes, which is assumed to be different in each season. To derive the actual factors, we imagine 10-day periods for each season. For example, winter, the grid’s off-peak season, enjoys three days of pure (100%) sunshine. Three days are 75% sunny with some clouds. Another three days have 50% sunshine and partial clouds. And one day has heavy clouds, rain, or snow with 25% sunshine.
C) On average, winter is 70% sunny. Summer is peak season and is assumed to be 80% sunny on average. Spring and Fall, both shoulder months, have sunshine levels of 77.5% and 75.0%, respectively. See footnote 10-E for graphical representation of how each season’s sunlight factor is derived for Scenario D’s adjustment to the grid for basic weather.
D) Since we must build to meet peak demand, we scale-up the system’s panel capacity using summer’s 80.0%. sunlight factor. The calculation for the scale up is simple—weather reduces panel performance by 20%, so panels operating at 80% are needed to meet peak demand. As a result, basic weather pushes installed panel capacity to 287.8 GW (235.7 GW / 0.80).
E) Total capital employed after adding the effects of basic weather jumps to $528.6B, or another 12.5%. The capacity factor of panels falls to 25.5%. BESS’s capacity factor remains at 12.8% as no additional BESS is needed to account for reduced sunlight from basic weather during daylight hours.
F) Bear in mind, the factors we’ve accounted for in Scenario D are the rising costs and reduced efficiencies caused by basic weather, not extreme storms that produce enough hail or heavy winds to take out large portions of solar farms.
6. Scenario E: Adding BESS O&M & Inefficiencies
A) Prior to now, we’ve assumed the system’s BESS charges and discharges at 100% efficiency every day for 20 years. This isn’t realistic. In Scenario E, we account for real-world wear and tear on batteries, inefficiencies and ongoing maintenance costs.
B) We now assume BESS charges and discharges at 90% of its capacity, after losses and inefficiencies. This affects the configuration of the system in two ways. First, nameplate BESS capacity increases by 7.2 GW, allowing BESS after losses to meet overnight peak demand of 65 GW ([65 + 7.2] x 0.90). Second, nameplate panel capacity increases by 9.0 GW. This results in an extra 7.2 GW (8.0 x 0.90) of capacity after applying the 20% reduction in panel output due to the effects of weather in peak months.
C) Scenario E also resolves the mismatch in assumed lifespans of panels (20 years) and BESS (15 years) by adjusting capital invested in BESS at the beginning of the project. Specifically, for BESS’s cost in year 16 we adopt NREL’s estimate (in 2024 dollars) of $225. This is below the $300 per KWhr for the original BESS installation. To obtain the five years (year 16 thru 20) of replacement BESS to achieve the 20-year life, we add a third of the $225 cost, or $75 per KWhr, to the upfront capital costs of BESS. This pushes BESS capital costs to $375 per KWhr.
D) BESS inefficiencies and replacement costs increase initial capital investment by $100.0B, or 18.9%, to $628.6B. This breaks down to $91.0B for additional BESS assets and $9.0B for additional panels. Capacity factors for panels and BESS fall to 24.7% and 11.5%, respectively.
7). Scenario F: Adding Solar Panel Fixed O&M
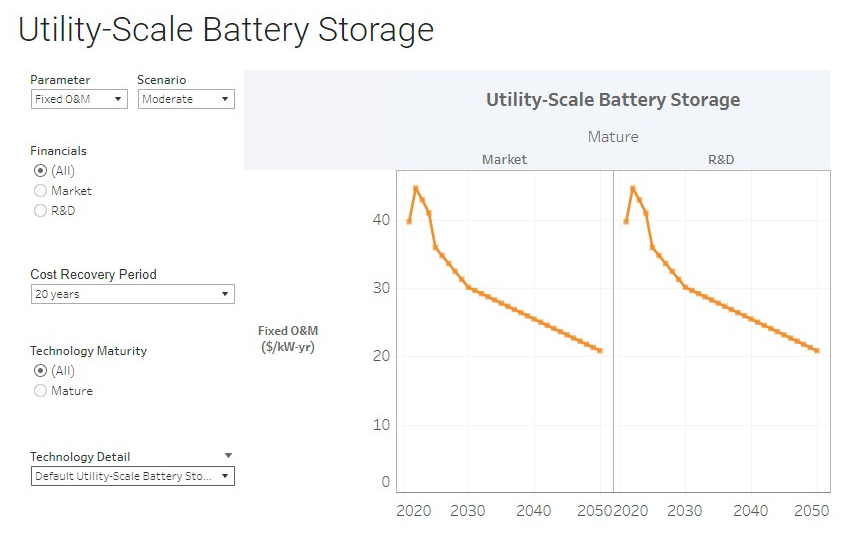
A) We’ve so far assumed no variable O&M for panels and BESS. We keep this assumption in place. But fixed O&M (FOM) is too material to ignore. For it, we select $25 per KW for panels and $15 per KW for BESS. Both are at the low end of NREL’s mid-point estimates. See footnotes 10-F and 10-G for more information on FOM estimates.
B) For panels, major FOM costs are insurance, land lease payments, property taxes, inverter specialists, transformers, connection fees, and replacement parts. Inspection fees, cleaning, electricians, array and module specialists, general maintenance, and other miscellaneous costs. BESS categories are similar, but include battery augmentation and exclude inverter costs.
C) We assume a 2% annual escalation in FOM.
D) Overall, our assumptions produce average annual FOM equal to 2.5% of initial capex for panels ($7.5B / $303.6B). For BESS, it’s 0.6% ($1.1B / $325.0B). Investors would likely be pleased with blended FOM of 1.4% of capex.
E) NREL’s O&M estimates seem to include replacing some large panel and BESS components over their technical lives. This supports our assumption that, once installed, such assets are replaced and upgraded rather than abandoned after 20 years. We therefore don’t allocate any additional O&M or capex for panel or BESS decommissioning. Terminal values also are not included.
F) Note—NREL bases its FOM estimates for panels on a mid (moderate) case over 20 years and mature technology. For BESS, the assumption is 4-hour utility scale storage and a 20-year life. These assumptions appear generous, as EIA data from 2024 show that solar panels in the US have only nine years average lifespans. It’s seven years for BESS.
8. Scenario G: Adding Realistic Cost of Capital
A) In Scenario G, we adjust the assumed pre-tax cost of capital from 7.00% to something more realistic. But let’s first clarify what we mean by the cost of capital. In short, it’s the pre-tax weighted average cost of capital (WACC) of the asset. Based on the principles of the Capital Asset Pricing Model (CAPM), it captures the total cost of capital from all sources needed to finance the system’s construction and operation. It includes all forms of debt and equity. Simply put, WACC is the average rate the project pays its lenders and investors. It also serves as the minimum unlevered return, or “hurdle” rate, investors require from the project.
B) Setting a practical WACC begins with determining a capital structure. Despite our doubts, we favorably assume a system of this size can be optimally funded with 60% non-recourse debt. The remaining 40% is equity.
C) For the interest rate on the debt portion of the financing, we look to 20-year US Treasury bonds—the life of the project. In the summer of 2024, such bonds traded at 4.50%. We assume a 75 basis-point risk premium. This gets us 5.25% as the debt rate. We assume equity investors expect a 10% annual return over the project’s 20-year lifespan.
D) After applying weightings of 60% and 40%, our debt and equity rate assumptions produce an after-tax WACC of 7.15%. If we assume the project’s pre-tax cash flows are reduced by 15% after taxes, this produces a pre-tax WACC of 8.41% (7.15% / 0.85). We round to 8.40%.
9. Scenarios H1 & H2: Adding Overbuild
A) Every grid experiences conditions that at some point challenge its ability to adequately meet demand. This is the worst-case scenario, and grids must be designed to deal with them. That is, we must add the necessary reserve or “overbuild” capacity to the system to protect against blackouts in a worst-case event.
B) We first determine what the worst-case scenario looks like, settling on a prolonged period of adverse daytime weather during a peak month. We pick five consecutive days of very cloudy, rainy and/or snowy conditions in the summer. During this period, we expect the generation of solar power to decrease by half.
C) We assume one-third of the overbuild pays for itself. This could be from arbitrage, export, or other opportunities arising from having the extra capacity on the system. Thus, only two-thirds of the overbuild capital and O&M costs are in the project economics.
D) We first calculated the breakeven for an overbuild in panel capacity—extra panels sufficient to meet all demand, including recharging BESS, for five days. We designate this as Scenario H1. It requires 303.6 GW of extra panel capacity. Net of 101.2 GW assumed to pay for itself, the cost of the overbuild is $202.4B. Total capital investment in Scenior H1 rises to $831.0 B. This is up 32.2% from $628.6B.
E) Here’s the quick math for determining the panel overbuild. Since the job of PV is to meet both daytime demand and charge batteries for nighttime demand, the worst-case scenario basically calls for a doubling of PV solar since power production is half of what’s normal during peak season. If we assume one-third of the capital and O&M cost for the overbuild in panels pays for itself via arbitrage opportunities, the panel capacity needed for overbuild is two-thirds existing capacity, or 202.4 GW. This pushes total panel capacity to 506.0 GW, up from 303.6 GW.
F) Next, we calculate the figures assuming the overbuild is limited to BESS capacity adequate to meet cumulative unmet demand of 3,600 GWhrs over five days. This Scenario H2 requires a whopping 332.8 GW of extra BESS capacity, after excluding 167.2 GW presumed to pay for itself.
G) Here’s the quick math for the additional BESS overbuild. If 72.2 GW of charged BESS capacity perfectly services 780 GWhrs of peak-season demand each night, 332.8 GW of charged capacity can be expected to discharge the necessary extra 3,600 GWhrs to cover both daytime shortfalls and all nighttime demand over five days (3,600 / (780 x 72.2)). This means total BESS required on the system, assuming BESS as the overbuild, is 72.2 GW + 332.8 GW = 405.0 GW. This pushes the combined capital costs for all BESS to $1.82 trillion and total capital investment to $2.1 trillion.
H) We assume daily demand does not change with worst-case conditions. One could argue that demand could rise or fall. For instance, it could fall during a hurricane, or rise during a winter storm. The latter would mean our overbuild is not sufficient.
10. Tables & Charts
A) Chart 1: Scenario A Supply & Demand (Baseline)
B) Chart 2: Scenario B Supply & Demand
C) Chart 3: Scenario C Monthly Supply & Demand
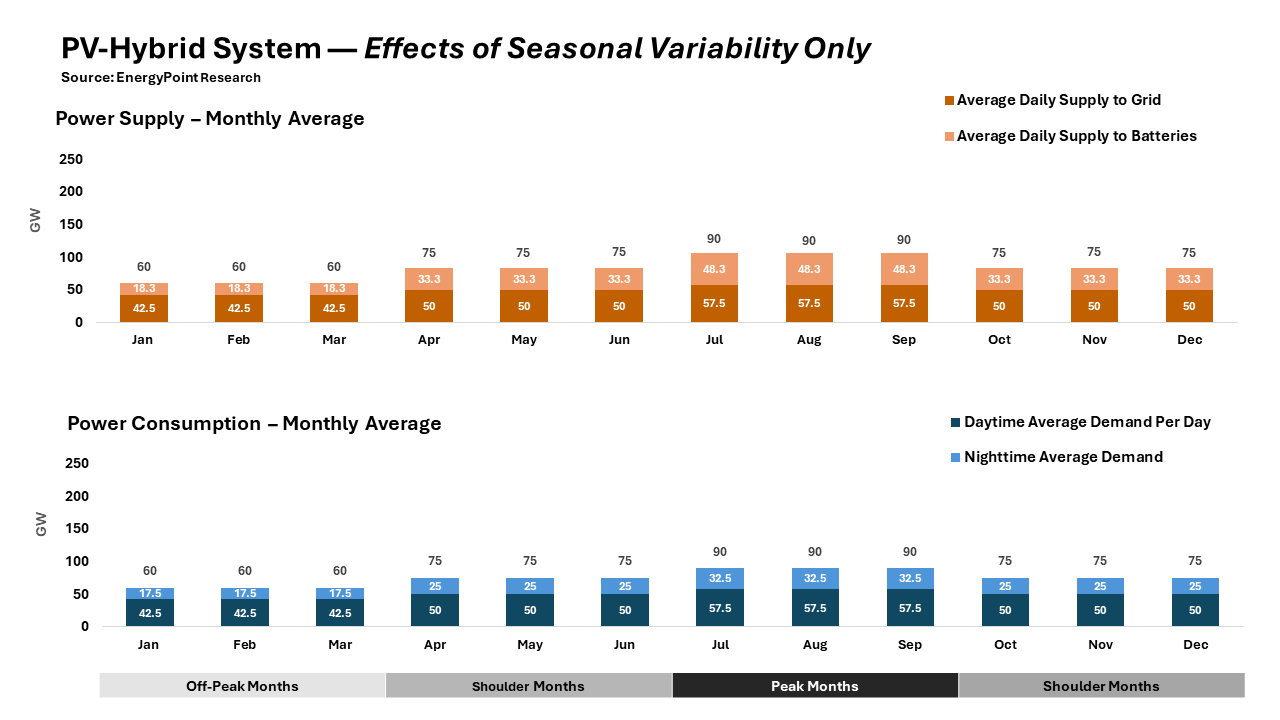
D) Chart 4: Scenario C Hourly Supply & Demand
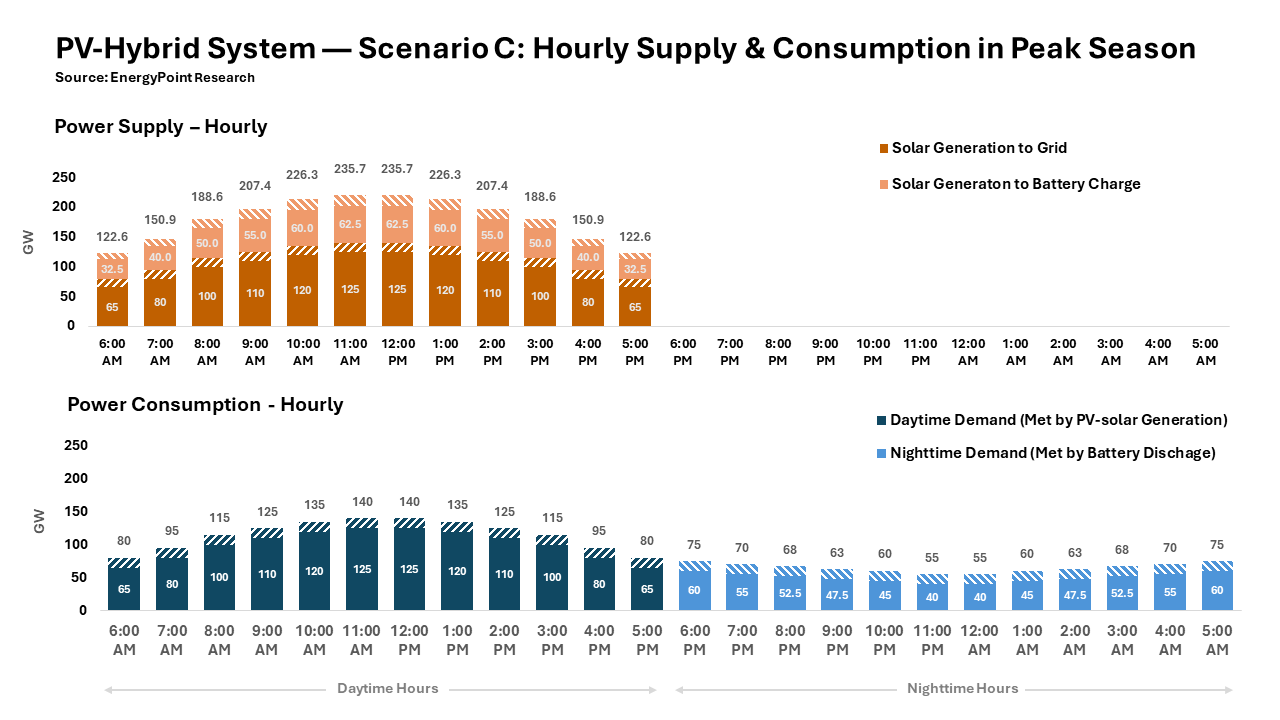
E) Chart 5: Scenario D Weather’s Effect on Solar Output by Season
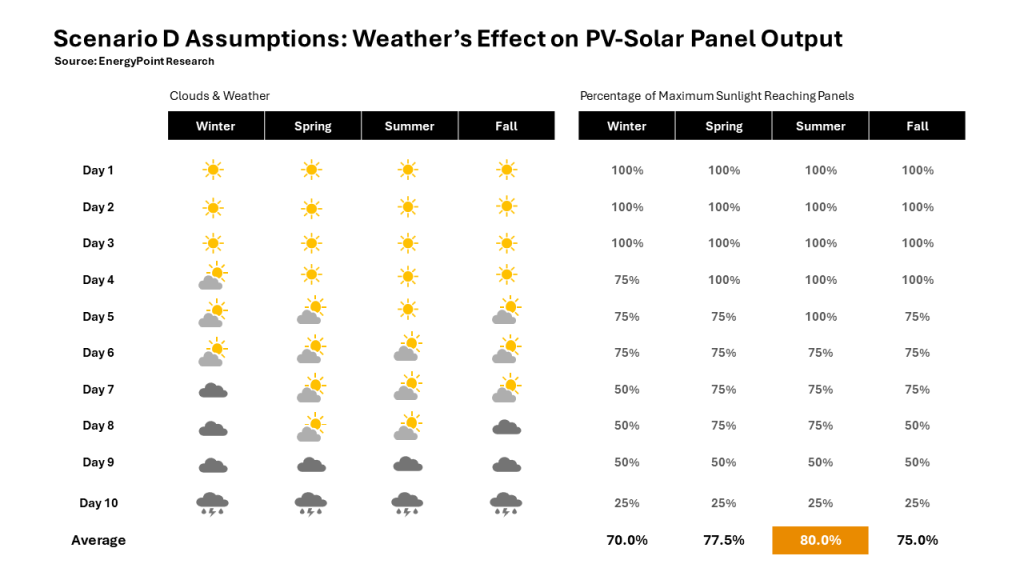
F) Chart 6: Scenario F Solar Panel Fixed O&M
G) Chart 7: Scenario F BESS Fixed O&M
H) Table 1: Scenario A BESS Capital Cost Estimates
I) Table 2: Summary of Assumptions & Outcomes (All Scenarios)


Thanks Doug and all who put this together. In my simple world of thinking, this again demonstrates that wasting tax payer money for energy that is not cost effective nor reliable should no longer be part of any further discussions in the USA (or the world come to think of it). 8 plus billion people, with the vast majority are wanting cheap reliable energy. Simple really!!
Yes, we tend to agree. That we have barreled down this path is really unfortunate. Going to cost us a ton.
Excellent apples-to-apples analysis and an enjoyable read, to boot. Thanks for sharing.
Our pleasure. Thanks for reading.
Doug, perhaps add comments about when, where, how it may make sense to add SOME wind and solar in a system without increasing costs much, if such is possible.
Yes, well get to the point in which were looking at diversified systems. But remember, we can’t diversify away the cost of generation when the costs of generation are almost all fixed. The money’s already out the door
Your methodology addresses the question of whether a power system fed by 100% solar makes sense economically.
It’s an interesting analysis and there are many details one could probe to better understand it, but beyond that, it makes me wonder who out there is advocating for a 100% solar power system that needs to be disproven?
To me it is quite obvious that if the US power system wants to minimize costs and maintain or improve reliability, it will utilize an optimal mix of many resources, and solar will play an increasing (but of course not exclusive) role in that because it is a low cost form of bulk energy. Wind, nuclear, gas, hydro, and geothermal will also be present.
If you agree that the optimal power system will be a mix of resources, then no single form of generation could ever pass the 100% supply test you are setting up here.
Okay, understood.
At this stage, our purpose is to test if solar + BESS is the cheapest form of energy on the grid… not if it’s the cheapest form of energy on a diversified grid. As a result, we’ve tested solar + hybrid without the presumed “cover” of other forms of generation. We’re going to conduct and publish similar narrow analysis looking at the cost of wind + BESS, natural gas + BESS, etc. We can then compare the costs of all three forms of energy in an apples-to-apples manner. We’ll then begin to address the cost of each when part of and/or added to already-diversified grids.
In the end, if solar is very cheap when its optimally employed on diversified systems, we will uncover and admit that fact. We’re a bit skeptical it will shown to be very often (if ever), but or analyses will examine it and be done in good faith… ie, transparent, able to be challenged, etc. It’s simply going to take some time to do the calcs and write them up. We’ll first publish on my LinkedIn account… and then finalize each here.Stay tuned.
Is that helpful?
I understand that it is an easy path to take to do a solar + battery analysis, but it is completely unrealistic.
Every grid in the world has hydro and/or wind not to mention potential for geothermal, marine energy, biowaste etc etc
Would anyone be naive enough to model a 100% coal + storage grid or even more unrealistic, nuclear + storage.
Would anyone model a transport system without trains or aircraft, let alone ships and barges
With respect Peter, no one has suggested a solar + battery analysis captures what a grid with other sources of energy might look like. What we do suggest is that exposing the weaknesses of a solar + battery grid undermines the argument that solar is the cheapest form of electricity.
This is the first step. We’ll be publishing additional analyses here and on LinkedIn examining how solar affects costs on grids with other forms of generation as well. Stay tuned.
Excellent analysis indeed! The conclusions are intuitive, but you have put numbers to the calculations to prove it. I haven’t checked the math but I assume you have.
That said, I feel some assumptions are on the light side. Insufficient assumptions on efficiencies (but keep the pro-solar camp happy!)
If you move your scenario a few thousand miles north of sunny Texas, to where the sun shines 6 hours per day in winter and 16 in summer, what does that do? You would also need a lot more BESS capacity. Unlike Texas where (some might argue with me), people can live without climate control, you cannot live where it’s -40 for weeks on end without power. I think in that scenario you will find an order of magnitude higher cost! Your scenario has to consider worst case.
Finally, I assume you will simulate with combinations of power sources. My burning question is ‘how much (non-green) power generation capacity sitting idle is required to minimize a crisis to ‘brownout’ level. A real life example is Germany last week where there was no wind and a lot of cloud for 4 days. In effect the idle capacity has significant cost—all passed on to consumers (or tax payers).
Thanks for doing all this detailed work for us!
Hi Alain. Yes, you are correct. To the extent we erred in our assumptions, they are typically favorable to solar’s economics. And these include everything from the cost of capital to the sunny location of assets. That said, even with these friendly assumptions, the breakeven for generation (without the burden of transmission and distribution costs) of $129 per MWhr is quite damning.
Regarding your question about what the capital requirements would be for a worst-case scenario, we actually did run that scenario. It’s scenario H and shows that because of the overbuild in panels that would be needed, the capacity factor of panels would fall from 24.8% to a very low 14.5%. BESS’s capacity factor is even lower at 11.9%. It’s the low capital efficiencies that drive the breakeven up.
Bravo! Real, valid technical analysis and commentary.
Thanks for the kind words, Michael. Much appreciated.
Thank you for continuing to dig deep into the details. This continues to be a fascinating read and topic.
I appreciate the depth of analysis completed here. A couple of questions:
What are the assumptions behind the $50/MWh costs for coal/gas power? What coal and NG prices are assumed? Do these exclude subsidies for the generation types?
I’ve done a little research on them myself but find quite some variability. Is this a sourced number, an average of several sources?
Fair question, yes, there can be a range of breakevens for coal and gas fired. Those breakevens we reference are for unsubsidized plants located in areas with relatively low fuel prices.
As luck would have it, we are currently posting on LinkedIn about the cost of serving the exact same grid as in this post with 100% gas-fired generation. When were done, we’ll have a good estimate.
Excellent analysis. However my issue with solar paneles has always been heat generation or emission if you will. With solar panels, technology is and has been struggling to reach 30% efficiency. Where is the other 70% of energy going. I believe mostly into heat emission. Where is the study on heat emission into the atmosphere and it’s effects? I read or heat about water cooled panels. Again, where is the study?
Okay, but does it matter where the 70% it’s going? After all, absent the existence of the heat panels, 100% of the sun… with all of its heat and energy… would still be hitting Earth?
Excellent methodology, Doug. Great work by you and your team.
I’m looking forward to how you & your team account for real world Dunkleflautes(sp?) and the true cost of balancing and backup generation – both in wasted hot standby energy as well as redundant capital costs.
Keep up the good work.
Thank you, Sean… for your readership and comments. One thing that we’ve noticed about these analyses is the tools they require us to build are useful for answering all kinds of questions that we’d otherwise be required to only theorize about. It’s a lot of work, but well worth it. And while it will take some additional tools to dive into the issues you highlight here, we’re in the process of doing so. How you will continue to read and comment as we share our methodology and findings.