


The evidence that customer satisfaction is an important metric for understanding, managing and anticipating the performance of today’s global oilfield suppliers continues to mount.
Recently completed analysis indicates the strongest tie yet (statistical significance levels are now well over 95%) between publicly traded oilfield suppliers’ customer satisfaction levels—as measured in EnergyPoint Research’s independent surveys—and the subsequent stock-price performance.
Based on the slope of the historical relationship (see below), a 1-point improvement (or advantage) in a supplier’s customer satisfaction rating, on average, equates to excess (or enhanced) stock-price returns of 17.8 percentage points over the subsequent 24-month period. Click here to see detailed tables by quartile.


Since EnergyPoint conducted its first survey over nine years ago, U.S.-listed publicly traded oilfield suppliers rating in the top halves and top quartiles of their oilfield segment peer groups have, on average, seen 24-month stock-prices outperformance of 17.4 and 8.6 percentage points, respectively. Suppliers rating in the bottom halves and bottom quartiles surveys saw their stock prices underperform the peer-group mean by 14.2 and 10.6 percentage points, respectively.
Overall, since 2004 the 24-month stock-price returns of oilfield suppliers ranking in the top quartile and top half exceed those of the bottom quartile and bottom half by an eye-popping 19.2 and 31.6 percentage points, respectively. The positive relationships between ratings and stock-price returns exist in each of the four upstream segments that EnergyPoint tracks.
So, what’s at work here?
In short, oilfield suppliers rating well in terms of customer satisfaction tend to benefit from more loyal customers, higher levels of positive word-of-mouth and referrals, and stronger brands. They are also more likely to win attractive pricing and contract terms—including longer-term commitments—from customers.
On the expense side, highly ranked suppliers enjoy lower customer-acquisition costs due to reduced churn rates and more referrals. Lower costs also stem from more effective planning, training and execution as visibility grows with more stable and committed customer and employee bases.
This virtuous set of factors helps explain why the seven publicly traded companies that have ranked in the top half of EnergyPoint’s surveys since we began conducting its studies in 2004—Core Laboratories, Dril-Quip, Helmerich & Payne, Lufkin Industries, Noble Corp, Newpark Resources and Rowan Companies—have, on average, seen their stock prices appreciate 451% over this period. This compares to an average return of 185% for the oilfield segment as a whole.
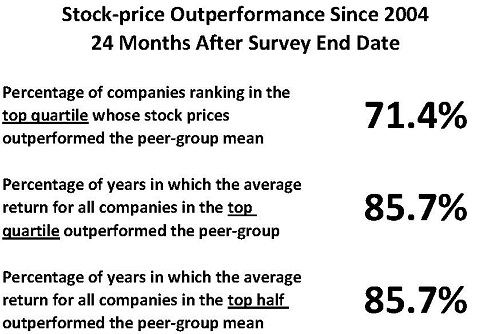
Finally, since 2004, a single publicly traded company ranking in the top quartile of EnergyPoint’s surveys has had a 71.4% chance of its stock price outperforming the peer-group mean in the subsequent 24-months. The probability of outperformance grew to 85.7% for the average “portfolio” return across all suppliers within the top quartile. Similar results exist for those ranking in the top half.
These findings are immensely compelling. But they are especially noteworthy given how many industry participants (and observers) still view customer satisfaction as too old-fashioned to matter. We encourage these non-believers to reconsider.