


Part 1 of this series presented evidence that mergers, on average, destroy rather than create value. Taking customers for granted, sometimes ignoring them altogether, is one reason why.
In this Part 2, we introduce a framework for understanding the different types of corporate combinations and the risks they pose to customers. By plotting past deals in the framework, we also examine the frequency of each type of transaction and their impact on stakeholders.
The framework is a simple matrix. On the X-axis is the Seller’s customer satisfaction rating in EnergyPoint’s surveys. The Y-axis is the Buyer’s rating. The midpoint of each is the industry average.
Every transaction falls into one of four quadrants, representing a transaction type as shown and discussed below.
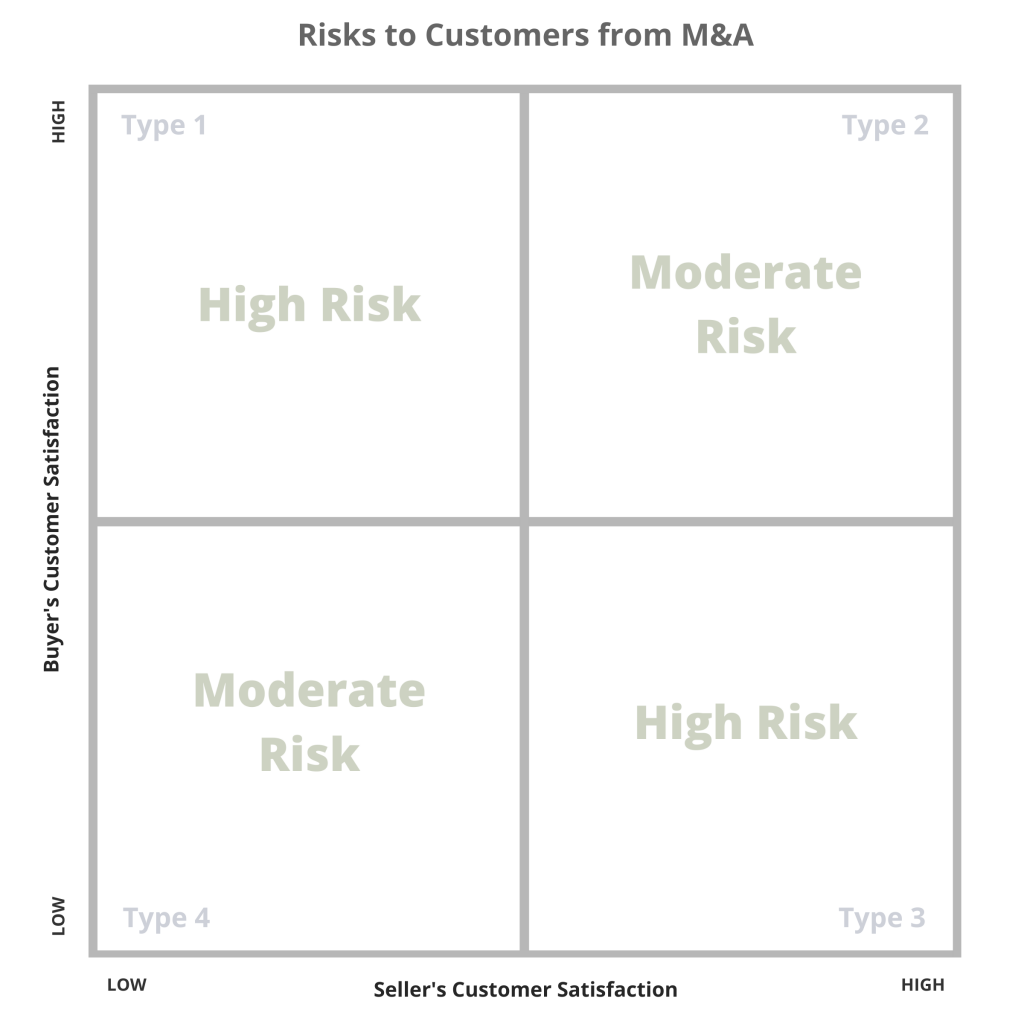
TYPE 1: High Satisfaction Buys Low Satisfaction
Logic suggests highly rated Buyers can upgrade the practices, offerings and personnel of lower-rated Sellers. Accordingly, Type 1 combinations should theoretically offer opportunity.
Such deals are actually rare, however. The fear that a lower-rated Seller will hurt the performance or reputation of a Buyer is one reason. The time and resources needed to remedy issues with the a Seller is another risk.
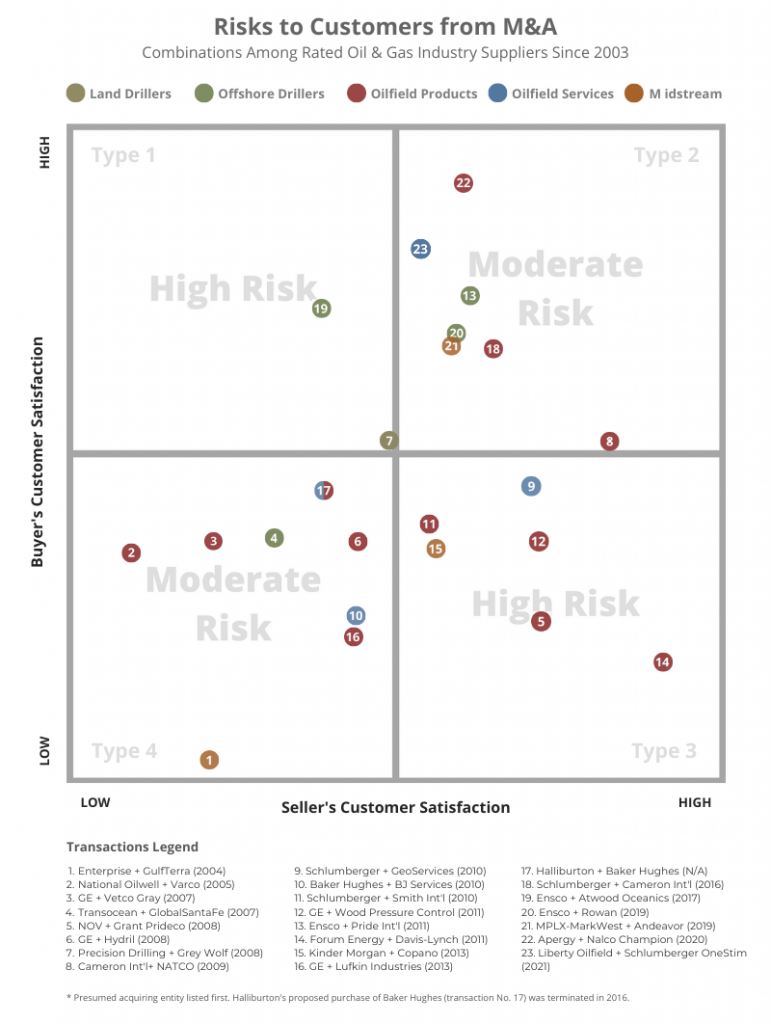
As Chart 2 shows, of the 22 oilfield transactions since 2003 for which EnergyPoint has data, only nine were Type 1 deals. Ensco’s purchase of Atwood Oceanics in 2017 falls squarely in this High Risk quadrant.
TYPE 2: High Satisfaction Buys High Satisfaction
Highly rated companies tend to respect each other’s client cultures. Hence, Type 2 combinations are typically lower risk for customers.
Since 2003, about a quarter of mergers between oilfield suppliers are judged to be Type 2 transactions. Apergy’s purchase of Nalco Champion in 2020 is an example.
Type 2 deals are associated with higher post-deal satisfaction levels, albeit modestly so. Larger awards accrue to investors, with average two-year stock-price returns exceeding the industry average by 16.2 percentage points.
No transaction type is foolproof, however. Integration efforts can be a distraction, even for Type 2 deals. Cultural issues can be particularly time-consuming. Best-case, the process goes well and customers enjoy only high levels of quality and service. When the process doesn’t go well, however, key employees and managers often leave, undermining performance and continuity.
On balance, Type 2 combinations are a Moderate Risk for customers.
TYPE 3: Low Satisfaction Buys High Satisfaction
It may seem companies with low customer satisfaction seldom take over those with high satisfaction. In reality, more than a quarter of the transactions in our database fit this billing.
In many cases, Buyers are larger players seeking to increase market share, add product or service lines, or to fend off competition. Schlumberger’s purchase of Smith International in 2010 is one example.
Type 3 combinations are disruptive and tend to damage the performance and reputation of the Seller and its brand. Since these deals can also come with hefty premiums—Schlumberger paid a 37.5% premium for Smith—cuts at the Seller can run deep. Buyers also tend to impose their own cultures more quickly and forcefully, sometimes pushing long-time employees and customers out the door.
While investors have enjoyed modest 24-month excess returns of +3.0 percentage points, Type 3 deals pose a High Risk to customers, with a median decline in customer satisfaction of 19.9 percent.
TYPE 4: Low Satisfaction Buys Low Satisfaction
Two companies that are unwilling or unable to look after their customers rarely solve the problem by joining forces. As both lack strong customer cultures, the focus for Type 4 deals is often cost reductions or expanding market power. Both typically lead to greater customer dissatisfaction.
Even so, Type 4 combinations carry only Moderate Risk for customers, who are already accustomed to below-average performance from the companies. On balance, satisfaction ratings in these transactions decline 1 percentage point within 24 months. Investor returns decline 2.6 percentage points.
These underwhelming results don’t discourage such deals, however. In fact, more than a third of the transactions in our database are Type 4. These include the National Oilwell and Varco merger in 2005, as well as Transocean’s ill-fated acquisition of GlobalSantaFe in 2007.
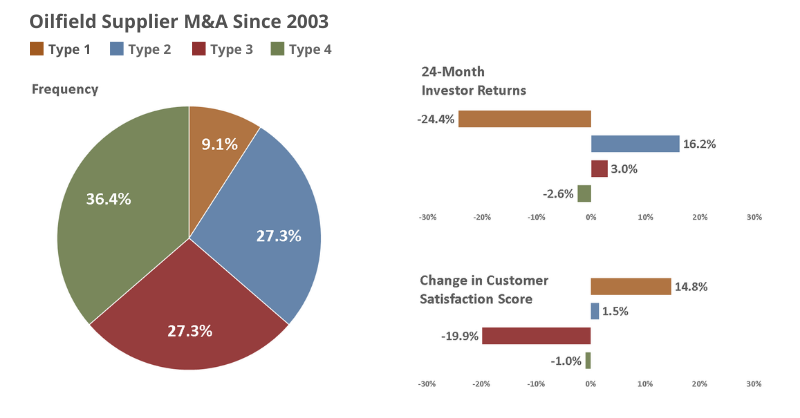
On the whole, there’s little evidence to suggest that M&A among oilfield suppliers benefits investors. On the other hand, there’s ample evidence that M&A hurts customers. At best, Type 2 transactions reward shareholders, while not harming customers. The remaining deal types are associated with both lower customer satisfaction and lower investor returns—odds and outcomes rarely worth pursuing.
Part 3 of the series focuses on the steps suppliers and customers can take to minimize risks to customer satisfaction and performance from M&A.
This article was originally published on November 20, 2013. It was revised and republished on July 13, 2021.